Fig. 7.
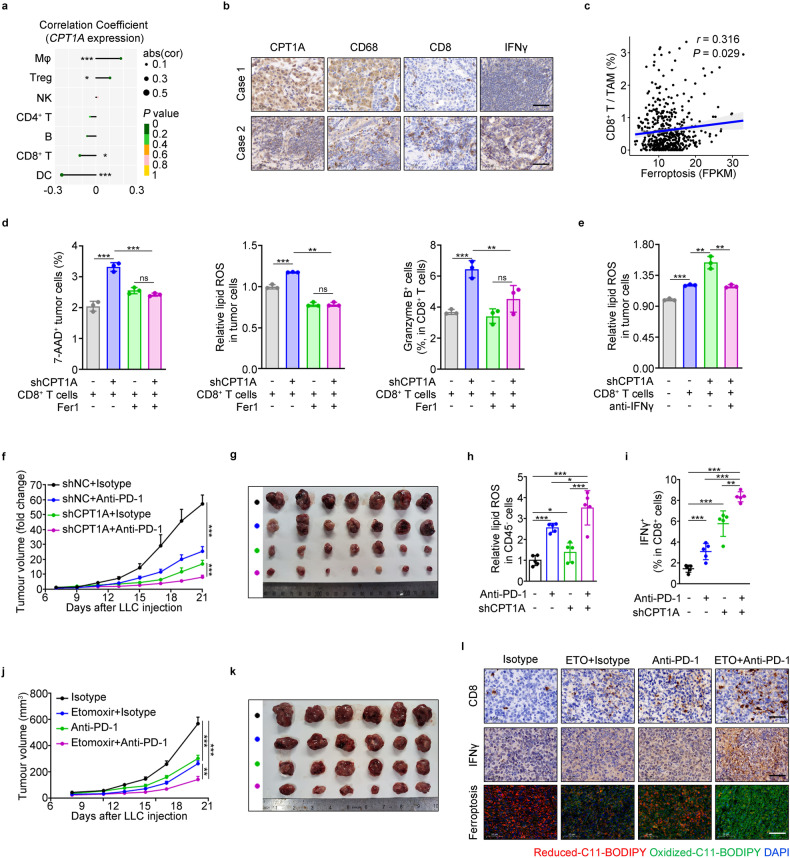
Targeting CPT1A improves ICB therapeutic efficiency in lung cancer. a Correlation analysis of immune cells infiltration in tumor with CPT1A expression in NSCLC patients. b Representative IHC staining for CPT1A, CD68, CD8 and IFNγ in the lung tissues from NSCLC patients. Scale bar: 50 μm (inserts). c Correlation analysis of the CD8+ T cells/TAMs infiltration with ferroptosis in NSCLC patients by bioinformatic analysis. d Percentage of 7-AAD+ cells or lipid ROS levels in LLC-shNC/shCPT1A cells and percentage of granzyme B+ cells in CD8+ T cells (isolated from the spleen of tumor-bearing mice) in the presence of Fer1 or not for 2 days determined by flow cytometry. e Lipid ROS levels in LLC-shNC/shCPT1A cells co-cultured with CD8+ T cells (isolated from the spleen of tumor-bearing mice) or not while treated with IFNγ neutralizing antibodies or vehicle for 2 days determined by flow cytometry. Effects of PD-1 antibody on tumor progression in tumor-bearing mice inoculated with LLC-shNC/shCPT1A cells (n = 7). Tumor growth curve (data represent the mean ± s.e.m.) (f). Photograph of the mouse tumor (g). Lipid ROS levels of CD45- cells in mouse tumor (h). Percentage of IFNγ+CD8+ T cells in the mouse tumor (i). Effects of PD-1 antibody and etomoxir on tumor progression in tumor-bearing mice inoculated with LLC-shNC/shCPT1A cells (n = 6). Tumor growth curve (data represent the mean ± s.e.m.) (j). Photograph of the mouse tumor (k). Representative images of C11-BODIPY staining and IHC staining for CD8 and IFNγ in the mouse tumor. Scale bar: 50 μm (inserts) (l). Data represent the mean ± s.d.; scale bar: 50 μm. *P < 0.05, **P < 0.01, ***P < 0.001. The statistical analysis was performed using a two-tailed Student’s t-test or Pearson’s correlation test

