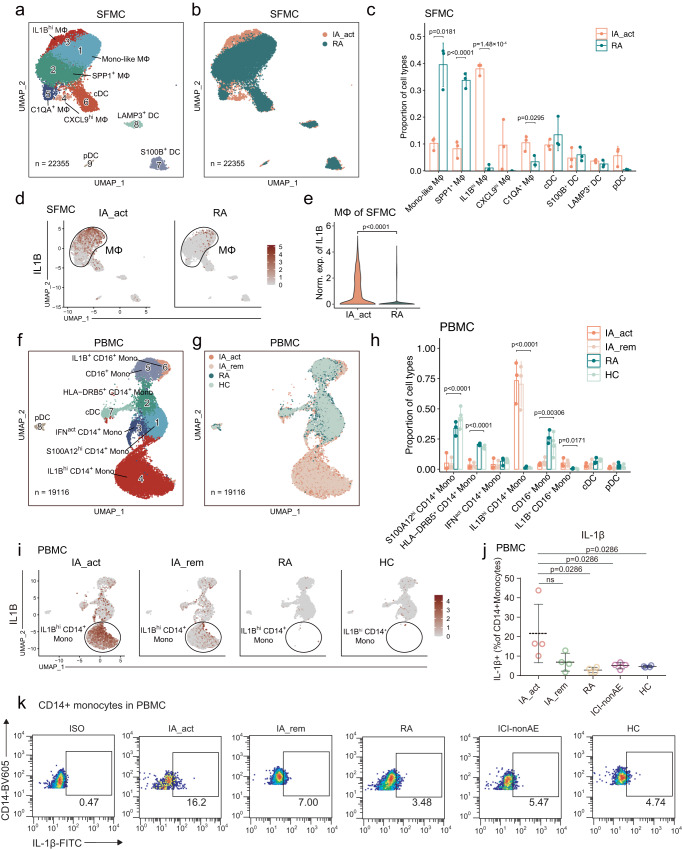
Fig. 2. Identification of IL1Bhi macrophages/monocytes as IA-associated myeloid cells.
a Identification of 9 subclusters of myeloid cells across all SFMC samples. b Distribution of myeloid cell subclusters of SFMCs between IA_act and RA. c Barplot showing the proportion (mean ± SD) of each myeloid cell subcluster in IA_act and RA with p-values calculated by unpaired two-sided t-tests. d UMAP plots showing IL1B gene expression in myeloid cells in SFMCs from IA_act (left) or RA (right) patients. e Quantification of the differences in IL1B gene expression of macrophages of SFMCs between the IA_act and RA by a two-sided Wilcoxon test. f Identification of 8 subclusters of myeloid cells across all PBMC samples. g Distribution of myeloid cell subclusters in PBMCs among patient groups (IA_act, IA_rem, RA, and HC). h Barplot showing the proportion (mean ± SD) of each myeloid subcluster among the patient groups with one-way two-sided ANOVA tests. i UMAP plots showing the IL1B gene expression of myeloid cells in PBMCs among the patient groups. j Quantification of IL1β+ CD14+ monocytes (percentage of IL1β+ cells in CD14+monocytes, mean ± SD) among the patient groups by flow cytometry. The data show n = 4 biological replicates over three independent experiments. Paired two-sided t-test compared the IA_act group with the IA_rem group. Wilcoxon tests compared the IA_act group with the RA, ICI-nonAE, or HC group. ns, nonsignificant. k Representative flow cytometry plots for (j). ICI-nonAE ICI-treated patients without irAEs, IA_act active inflammatory arthritis, IA_rem inflammatory arthritis in remission, RA rheumatoid arthritis, HC healthy control, ISO isotype, Mono-like monocyte-like, MΦ macrophages.

