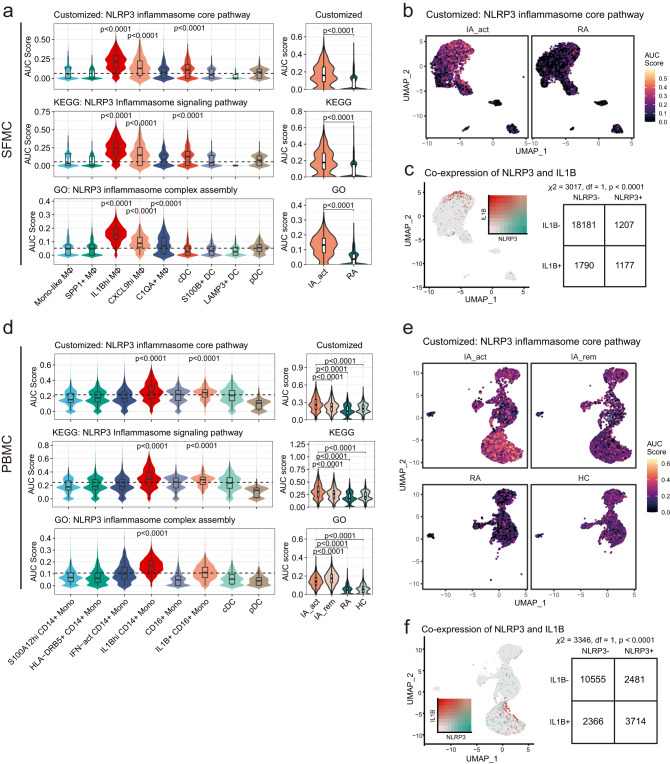
Fig. 4. Activated NLRP3 inflammasome signaling was characteristic of IL1Bhi myeloid cells and downregulated after treatment.
a The differences in NLRP3 inflammasome-related pathway signature scores among subclusters of myeloid SFMCs (left) and between IA_act and RA (right). The AUC was calculated by the AUCell algorithm (see the “Methods” section). b UMAP visualization of customized NLRP3 inflammasome core pathway signature scores across myeloid cells in SFMC in the IA_act and RA groups. c Left, UMAP visualization of the coexpression of the IL1B gene and NLRP3 gene in myeloid SFMCs. Right, a two-sided chi-square test examining the association of NLRP3+ cells with IL1B+ cells in myeloid SFMCs. d The differences in NLRP3 inflammasome-related pathway signature scores among subclusters of myeloid PBMCs (left) and patient groups (right). The AUC was calculated by the AUCell algorithm (see the “Methods” section). e UMAP visualization of the customized NLRP3 inflammasome core pathway signature score across myeloid cells in PBMCs in the IA_act, IA_rem, RA, and HC groups. f Left, UMPA visualization of the coexpression of the IL1B gene and NLRP3 gene in myeloid PBMCs. Right, a two-sided chi-square test examining the association of NLRP3+ cells with IL1B+ cells in myeloid PBMCs. Two-sided Wilcoxon tests comparing one subcluster and all other clusters were applied for the data in (a) and (d). In the box-plots of (a) (n = 6) and (d) (n = 13), the center lines denote the median of the AUC score; the lower and upper limits of the boxes denote the 25% and 75% quantile, respectively. Two-sided Wilcoxon tests comparing the median AUC score of one subcluster with all other clusters. The horizontal dashed line denotes the median AUC score of all the cell clusters, and only the clusters with significantly increased medians were denoted with p-value. IA_act active inflammatory arthritis, IA_rem inflammatory arthritis in remission, RA rheumatoid arthritis, HC healthy control, Mono-like monocyte-like, MΦ macrophages.

