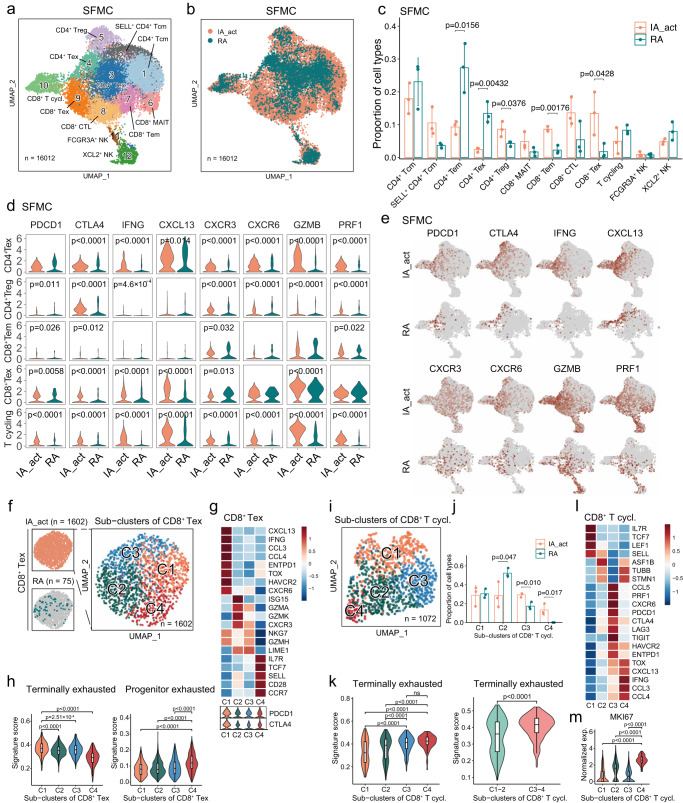
Fig. 5. Heterogenous patterns of CD8+ T-cell exhaustion in the SFMCs of PD-1-IA patients.
a Identification of 12 subclusters of T and NK cells across all SFMC samples. b Distribution of T/NK cell subclusters of SFMCs between IA_act and RA. c Quantification of the fraction (mean ± SD) of each T/NK subcluster between the patient groups with a two-sided t-test. d Violin plots showing the expression of genes of interest in selected T/NK cell subclusters between IA_act and RA with a two-sided Wilcoxon test. e UMAP plots showing the expression of genes of interest in T/NK cell subclusters between IA_act and RA. f Subclustering of 1602 exhausted CD8+ T cells from the SFMCs of IA_act patients into 4 subsets. g Heatmap showing the expression of marker genes across subsets of exhausted CD8+ T cells (CD8+ Texs) (top) and violin plot showing the expression of the PDCD1 and CTLA4 genes across subsets of CD8+ Texs (bottom). h Quantification of terminally exhausted (left) and progenitor exhausted signature scores (right) among CD8+ Texs with an unpaired two-sided Wilcoxon test. Signature scores were calculated by the AUCell algorithm (see the “Methods” section). i UMAP plot showing 1072 cycling CD8+ T cells in SFMCs from all individuals separated into 4 subsets. j Quantification of the subcluster proportions (mean ± SD) between IA_act and RA with a two-sided t-test. k Quantification of the differences in the terminally exhausted signature score among 4 subsets of cycling CD8+ T cells (left) and between the C1-2 subset and C3-4 subset (right) with a two-sided Wilcoxon test. l Heatmap showing the expression of marker genes across subsets of cycling CD8+ T cells. m. Quantification of the MKI67 gene expression between the C4 subset and other subsets with a two-sided Wilcoxon test. In the box-plots of (h), (k), and (m), the center lines denote the median of the signature score or normalized gene expression in each subset; the lower and upper limits of the boxes denote the 25% and 75% quantile, respectively. IA_act active inflammatory arthritis, IA_rem inflammatory arthritis in remission, RA rheumatoid arthritis, HC healthy control, T.cycl. cycling T cells.

