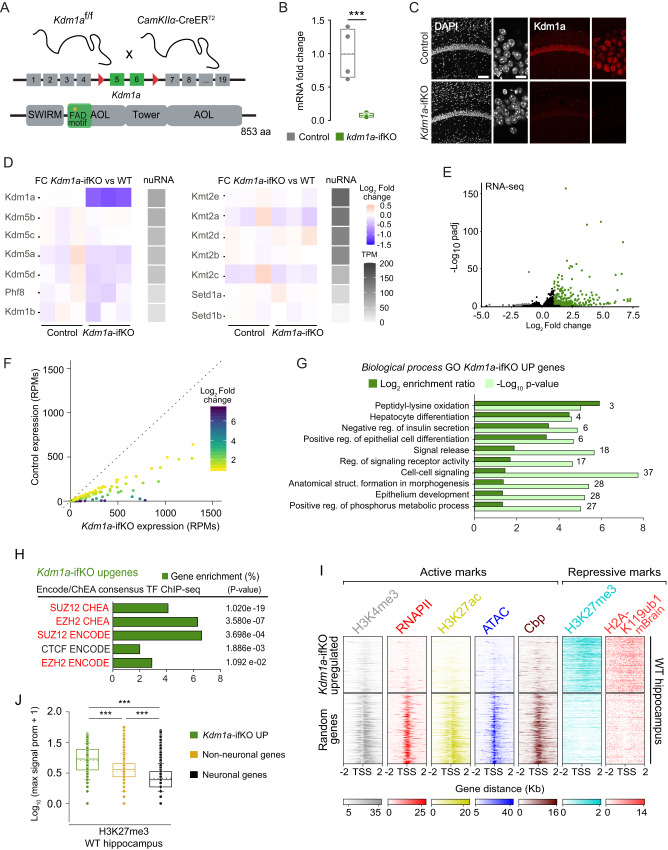
Fig. 1. Kdm1a loss in adult excitatory neurons causes de-repression of PRC2-repressed nonneuronal genes.
A Genetic strategy used to deplete Kdm1a. Floxed exons and the encoded flavin adenine dinucleotide (FAD)-binding domain are highlighted. Kdm1a also has amine oxidase-like (AOL), SWIRM and tower domains. B Kdm1a transcript levels 4 weeks after TMX administration (n = 6 Kdm1a-ifKO; n = 4 control (CT); T = 34, p = 0.01, Mann-Whitney test, two-tailed). Box plots indicate median value, interquartile range, minimum and maximum value (whiskers), and individual data points. C CA1 immunostaining with anti-Kdm1a 2 months after TMX. DNA was counterstained with DAPI. Scale bars: 100 µM and 10 µm in insets. D Gray scale: Nuclear RNA levels for KDMs and KTMs in excitatory forebrain neurons26 in transcripts per million (TPM). Color scale: Log2FC between genotypes. E Volcano plot of differential expression analysis (n = 3 CT and 3 Kdm1a-ifKO). Upregulated genes are labeled in green and downregulated genes in grey (Wald test, p adj <0.05; |log2 FC | > 1). F Scatter plot of upDEGs expression in Kdm1a-ifKOs and controls. G GO enrichment analysis for Biological processes in upDEGs (Fisher’s exact test). Number of genes, enrichment ratio and statistical significance are shown. H Enrichment analysis for TF binding in upDEGs (Fisher’s exact test, p adj <0.05; log2FC > 1). PRC2 subunits are highlighted in red. I Density of ChIP-seq reads for H3K4me3, H3K27ac, accessibility measured by ATAC-seq, binding of CBP and RNAPII, and the PRC2-related repressive marks H3K27me3 and H2AK119ub. Heatmaps represent the enrichment for all these marks in hippocampal chromatin of wild type (WT) mice around the TSS ( ± 2 Kb) of upDEGs and the TSS of a similarly sized set of random genes expressed in neurons. J Quantification of H3K27me3 signal in the set of upDEGs (n = 514) compared with neuronal genes (n = 14902) and with nonneuronal genes not affected by Kdm1a loss (n = 11372; Mann–Whitney U Statistic, two tailed, pval ***<0.0001). Box plot as described in panel B except for whiskers showing SD values. Source data are provided as a Source data file.

