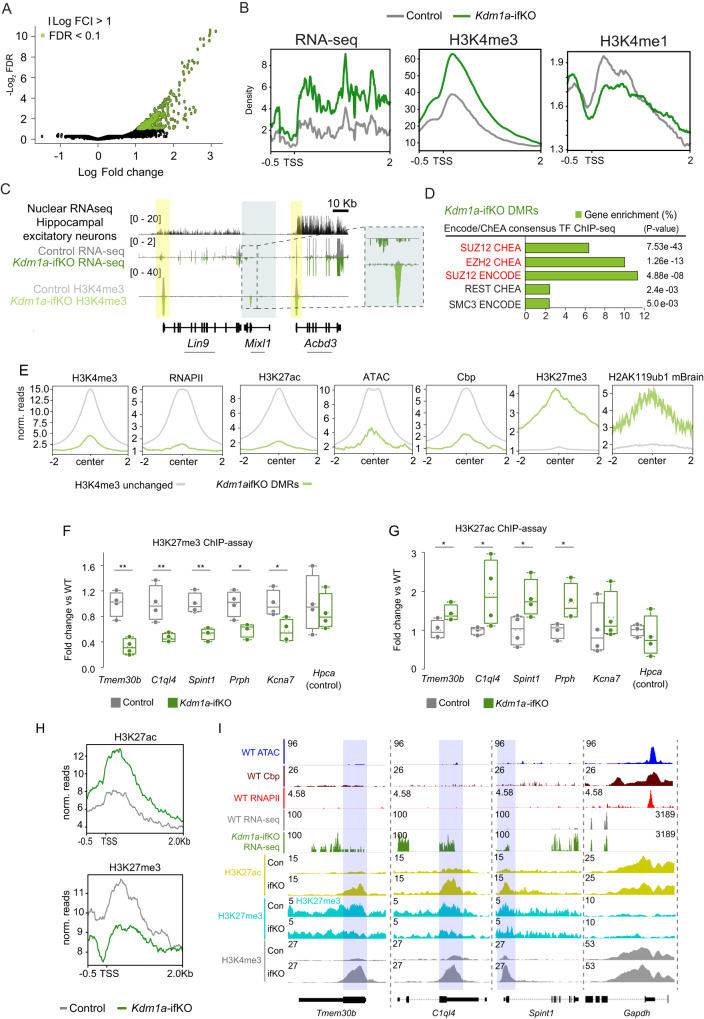
Fig. 2. Gene de-repression is accompanied by dramatic changes in the epigenetic profile.
A Volcano plot of H3K4me3 DMRs (n = 2 for CT; n = 3 for Kdm1a-ifKO; FDR < 0.1, |log2FC | > 1). B Density distribution of RNA-seq, H3K4me3, and H3K4me1 reads around the TSS of upDEGs (distance for TSS, −0.5 Kb, and +2 Kb). C Genomic snapshot around Mixl1, as an example of upregulated gene. The graph shows mRNA-seq and H3K4me3 profiles in the adult hippocampus of Kdm1a-ifKO and control littermates. The upper nuclear RNA-seq track shows that Mixl1 is not expressed in excitatory forebrain neurons26, whereas neighboring genes are highly expressed. Data range is shown in brackets. Arrows indicate the direction of transcription. D Enrichment analysis for TF binding at H3K4-DMRs in Kdm1a-ifKOs. Subunits of PRC2 are highlighted in red (Fisher exact test, p adj <0.05; log2FC > 1). E Graphs show the enrichment for active and repressive marks around the center ( ± 2 Kb) of H3K4-DMRs (green track; FDR < 0.1) compared to regions without changes in H3K4me3 (grey track; FDR > 0.1) in the chromatin of WT mice. F, G H3K27me3 (F) and H3K27ac (G) ChIP-assays in Kdm1a-ifKO and control littermates revealed changes in several upDEGs (CT, n = 4; Kdm1a-ifKO, n = 4). The Hpca gene is shown as a negative control. Boxplots indicate median value, interquartile range, minimum and maximum value, and individual data points (two-tailed t-test, **p-val < 0.001; *p-val2 < 0.01). H Density distribution of H3K27ac and H3K27me3 reads around the TSS of upDEGs (distance to TSS, −0.5 Kb, and +2 Kb) in Kdm1a-ifKOs and control littermates. Compare with the H3K4me3 and RNA profiles presented in panel 2B. I Genomic snapshots show three examples of upDEGs, Tmem30b, C1ql4, and Spint1; and one non-changing gene, Gapdh. Chromatin accessibility, CBP, and RNAPII ChIP-seq profiles from hippocampus of adult mice are plotted. Source data are provided as a Source data file.

