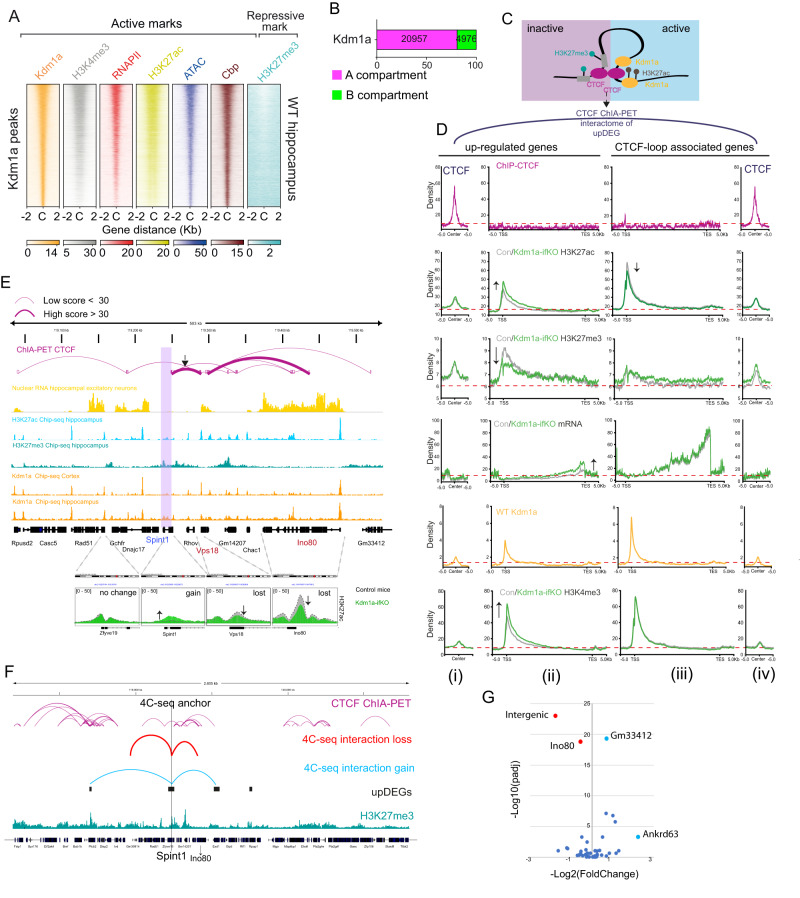
Fig. 4. Topological association between Kdm1a and its target genes.
A Heatmaps of active and repressive marks in the chromatin of WT mice ( ± 2 kb of Kdm1a peaks). B Distribution of Kdm1a peaks between chromatin compartments. C Schematic illustration of CTCF connection in upDEGs. D Density plots showing ChIP-seq signal for H3K27ac, H3K27me3 and H3K4me3 in CTCF loops associated with upDEGs in hippocampal chromatin of control and Kdm1a-ifKO mice. Four graphs are presented for each hPTM corresponding to (i) ±5 kb window centered on the CTCF peaks directly linked to the upDEGs; (ii) upDEGs metagene; (iii) metagene for the CTCF-loop associated genes; and (iv) ±5 kb window centered on the CTCF peaks directly linked to the upDEG-associated genes. Transcript levels in control and ifKO mice, and CTCF and Kdm1a density plots in WT hippocampal chromatin are also shown. E Genomic profiles and CTCF ChIA-PET interactions at the Spint1 locus (purple box). CTCF loops bring the H3K27me3-enriched Spint1 gene closer to active genes Vps18 and Ino80. The lower panels show H3K27ac levels in the chromatin of control and Kdm1a-ifKOs at Spint1 and neighbour genes linked through first and second-order CTCF connections. Vps18 and Ino80 show lower levels of H3K27ac in Kdm1a-ifKOs, in parallel to the increase for this hPTM in Spint1. The dashed line represents H3K27ac density in control mice. Transcript levels are shown in the yellow track. F 4C-seq interaction profiles using the Spint1 promoter as viewpoint (anchor). Interactome profiles were generated using the hippocampus of Kdm1a-ifKO (n = 3) and control mice (n = 3). Significant reduction in the interaction of Spint1 was observed with the gene body of Ino80 and with an intergenic region (in red), while a higher interaction frequency was observed with Gm33412 and Ankrd63 (in blue), which are also upregulated in Kdm1a-ifKO neurons. The position of upDEGs is indicated with black boxes; the tracks for H3K27me3 ChIP-seq and CTCF-ChIA-PET interactions are shown. G Volcano plot showing the most significant changes on interaction frequencies in the 4C-seq generated with Spint1 as viewpoint (likelihood ratio test, pval <0.1). Source data are provided as a Source data file.

