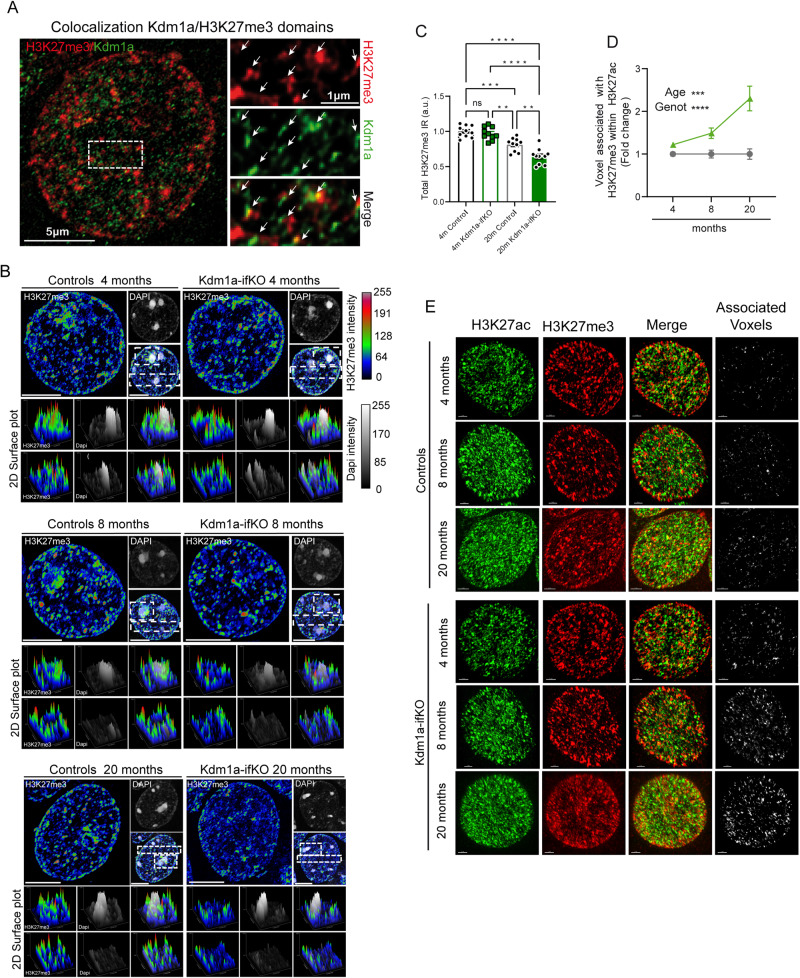
Fig. 5. Altered chromatin compartmentalization in Kdm1a-ifKOs progresses with age.
A Super-resolution images show the colocalization of Kdm1a and H3K27me3-immunoreactivity in the nucleus of CA1 pyramidal neurons in WT mice. B Representative super-resolution images show the disorganization of H3K27me3 condensed aggregates in the nucleus of Kdm1a-ifKO neurons from 4- (top panels), 8- (middle panels) and 20-month-old (bottom panels) mice compared to control littermates. The distribution of H3K27me3 puncta at selected regions (white boxes) is shown as a 2D surface plot in the panels below. Fluorescence intensity of H3K27me3 and DAPI labeling is represented with a color gradient. The red signal indicates the highest detected H3K27me3 signal intensity and the blue the lowest. Scale bar: 5 μm. C Measurement of H3K27me3-immunoreactive signals in the nucleus of CA1 hippocampal neurons (n = 10) of 4-, 8- and 20-month-old Kdm1a-ifKO and control littermates (4 m, n = 3; 20 m, n = 4 per genotype). Tukey’s multiple comparison test, two-sided, ****p-val < 0.0001; ***p-val < 0.001; **p-val < 0.01. D Quantification of association between H3K27me3-positive voxels and H3K27ac signal in Kdm1a-ifKOs and control mice at different ages (4 m, n = 15 cells; 8 m, n = 10 cells; 20 m, n = 11 cells). The quantification of voxels with overlapping signals revealed that the proportion of H3K27me3-positive voxels with H3K27ac signal increased with age in Kdm1a-ifKOs compared to control mice (4 m, n = 3 mice; 8 m, n = 2 mice; 20 m, n = 4 mice per genotype; two-way ANOVA: ****p-val < 0.0001¸***p-val < 0.001). E Representative super-resolution images show the increased coincidence of H3K27me3 and H3K27ac signals in the nucleus of Kdm1a-ifKO neurons from neurons from 4-, 8- and 20-month-old mice compared to control littermates. Scale bar: 2 μm. Data are presented as mean values ± SEM in (C) and (D). Source data are provided as a Source data file.

