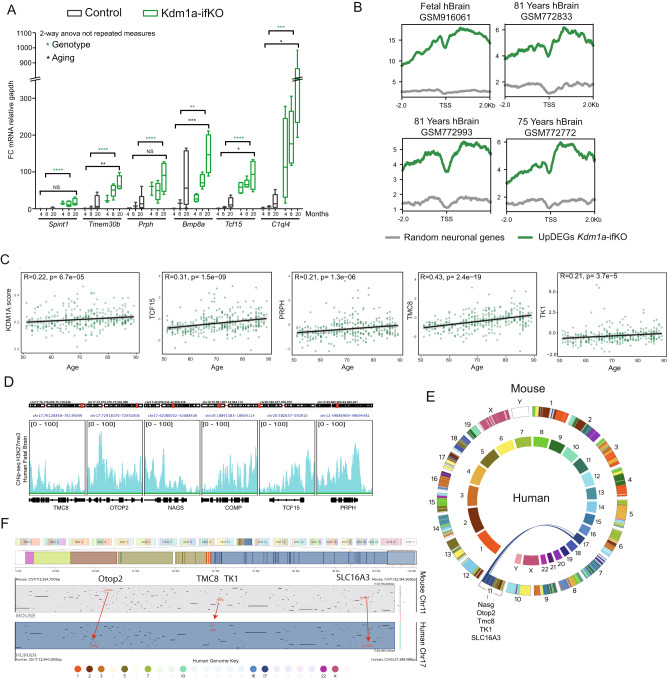
Fig. 7. Derepression of upDEGs both in mice and humans correlates with aging.
A Time course analysis of selected upregulated genes, Prph, Tmem30b, Spint1, Bmp8a, Tcf15 and C1ql4 of Kdm1a-ifKO neurons compared with control neurons using RT-PCR (4 m, n = 3; 8 m, n = 3; 20 m, n = 6 in controls; and 4 m, n = 4; 8 m, n = 5; 20 m, n = 4 in Kdm1a-ifKOs). Boxplots indicate median value, interquartile range, minimum and maximum value, and individual data points. Two-way ANOVA: ****p-val < 0.0001; **p-val < 0.001; * p-val < 0.01; NS pval >0.01. B Density plot of H3K27me3 in adult and fetal human brain samples (datasets used and ages are indicated in the figure). H3K27me3 was plotted at the TSS of the human homolog genes of upDEGs in Kdm1a-ifKOs (log2FC > 1). C Gene expression correlation between age and transcript level of Kdm1a-ifKO upDEGs (log2FC > 1.5) (n = 320). Kdm1a score was calculated using the Kdm1a-ifKO genes represented in the human dataset (100 out of 165 genes). Spearman Correlation, pval <0.05. Several examples of genes with a high and intermediate degree of correlation are shown. D Genome snapshot of H3K27me3 enrichment in fetal brain samples for several genes upregulated during human and mouse aging: TMC8, OTOP2, NAGS, COMP, TCF15, and PRPH. E, F Analysis of regions of conserved synteny using the web-based application The JAX Synteny Browser104. Chromosome position analysis of Nags, Otop2, Tmc8, Tk1, and Slc16a3 in the human and mouse genomes (E). Representation of human-mouse synteny across the entire domain spanning Otop2, Tmc8, TK1, and Slc16a3 (chr17 and chr11, respectively in human and mouse) (F). Source data are provided as a Source data file.

