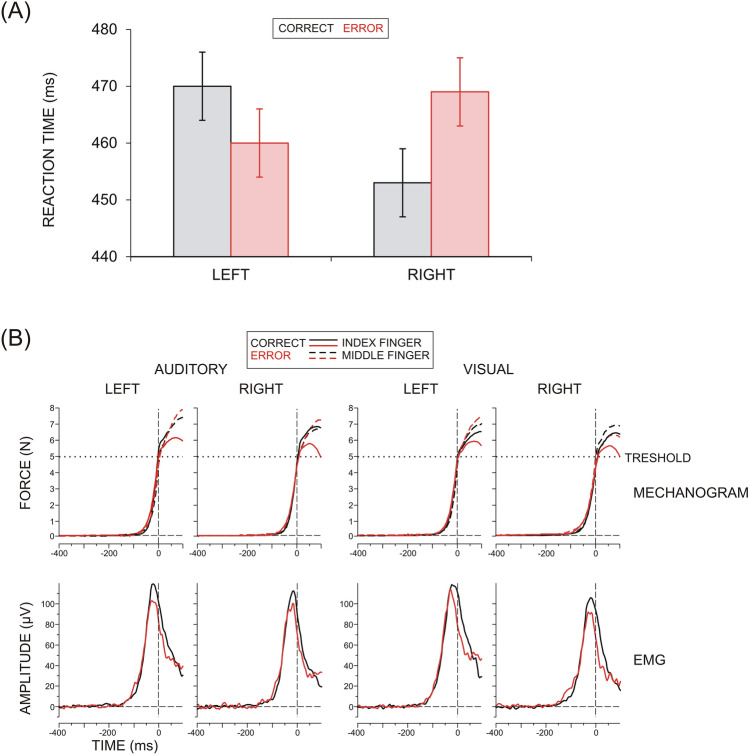
Figure 1.
(A) Group mean reaction times ± SE for correct and error responses produced with the left and the right hand. (B) Group average mechanograms (upper panel) and electromyograms (EMG, lower panel) of correct and error responses produced with the index and middle fingers of the left and the right hand in two experimental conditions (auditory and visual). A threshold of the mechanogram at 5 N is used to determine movement onset (at 0 ms).

