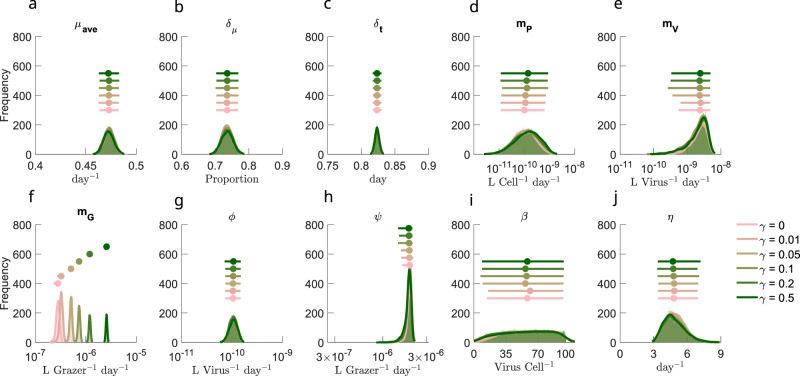
Fig. 3. Differences in inferred life-history traits across the specialist-generalist gradient.
a–j Parameter posterior distributions for different ECLIP models. Parameters are a μave: average Prochlorococcus division rate, b δμ: division rate amplitude, c δt: phase of division rate, d mP: higher order Prochlorococcus loss rate, e mG: higher order viral loss rate, f mG: higher order grazer loss rate, g ϕ: viral adsorption rate, h ψ: grazer clearance rate, i β: viral burst size, and j η: viral-induced lysis rate. Jittered median (dot) and 95% CI range (horizontal line) for each of the models are shown above density plots. Full details of parameter bounds are shown in Table S2; see Supplementary Information for more details.

