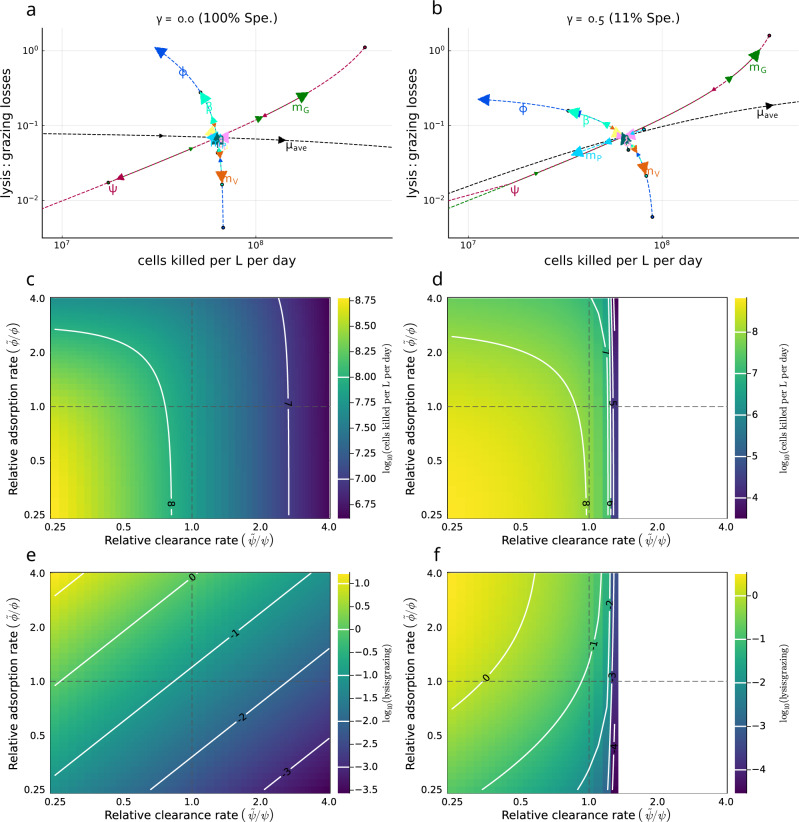
Fig. 7. Assessing robustness of the estimated magnitude and source of Prochlorococcus daily mortality.
Sensitivity analysis was conducted based on the MCMC inferred parameter sets for the detrended model with specialist grazing (γ = 0, 100% Spe.) (a, c, e) and the most generalist grazing model (γ = 0.5, 11% Spe.) (b, d, f). a, b A single parameter is varied at a time with all others fixed to evaluate changes in Prochlorococcus daily mortality and the relative role of viral-induced lysis vs. grazing. Arrows, and label positioning relative to the intersection, indicate the effect of increasing each parameter, with circles denoting the smallest value of each parameter. Label and line colors are the same for each parameter varied. Parameters were varied from 0.25x to 4x the baseline value. Parameters are μave: average Prochlorococcus division rate, δμ: division rate amplitude, δt: phase of division rate, mP: higher order Prochlorococcus loss rate, mG: higher order viral loss rate, mG: higher order grazer loss rate, ϕ: viral adsorption rate, ψ: grazer clearance rate, β: viral burst size, and η: viral-induced lysis rate. c–f Covariation between adsorption () and clearance rates () relative to their MCMC inferred values (respectively, ϕ and ψ) and the effect on Prochlorococcus daily mortality (c, d) and the lysis:grazing ratio (e, f). Dashed lines indicate the MCMC inferred value. Contours in (c–f) represent differences in magnitude. Note 100 in (e, f) represents the case when grazing losses are equal to viral-induced losses (100 = 1). White space regions in (d, f) denote scenarios when Prochlorococcus abundance becomes less than 1 cell per L.

