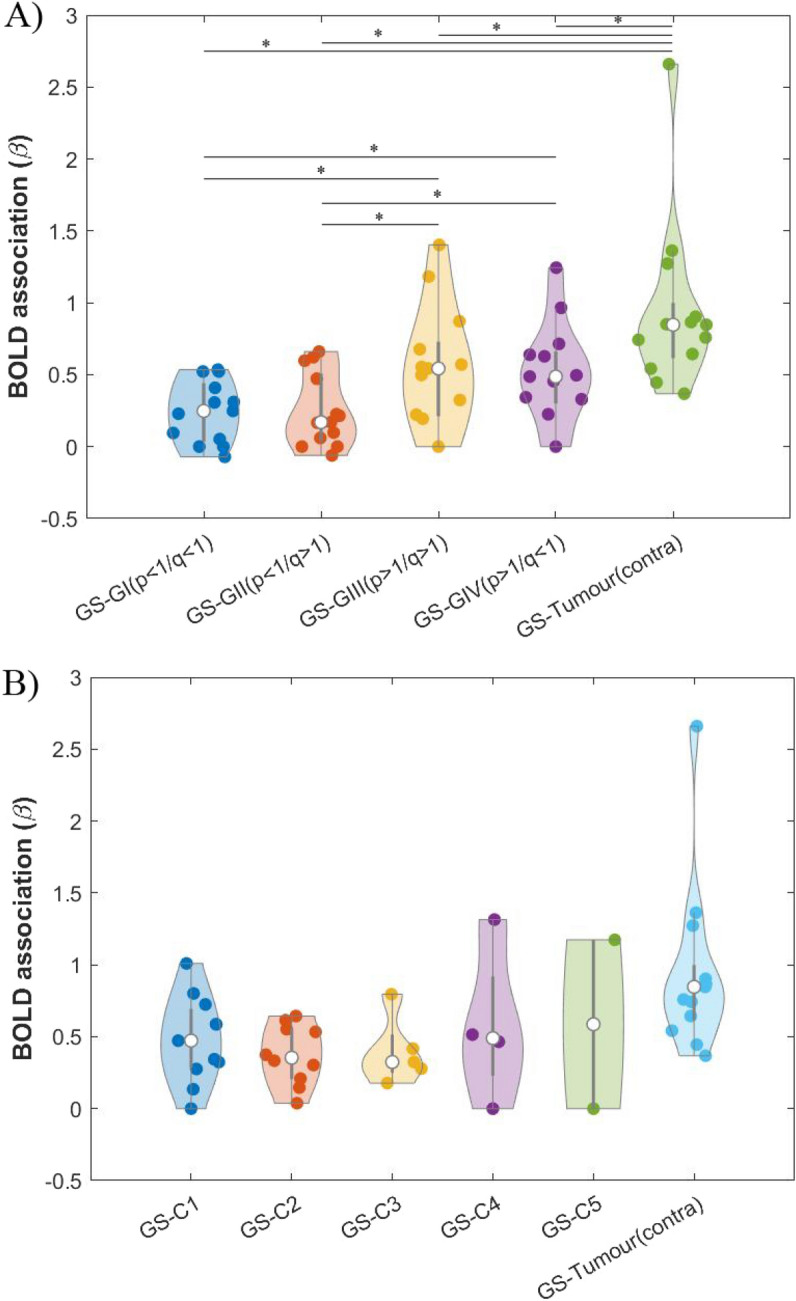
Figure 5.

Distribution of β association values across participants (represented by individual dots) between: 1) BOLD signal derived from grey matter outside the tumour (GS), and 2) BOLD signal derived from the tumour subregions and from the region contralateral to the tumour (tumour (contra)). In the latter case, β values were calculated using a GS estimation that excluded the corresponding voxels contralateral to the tumour (to avoid overlapping between the independent and dependent variables). White dots represent the median of the data in each case; the thick grey line indicates the interquartile range. (A) DTI approach with tumour subregions: groups I, II, III and IV. * indicates significant differences, p-FDR < 0.01. (B) NODDI approach with tumour subregions: C1, C2, C3, C4 and C5.
