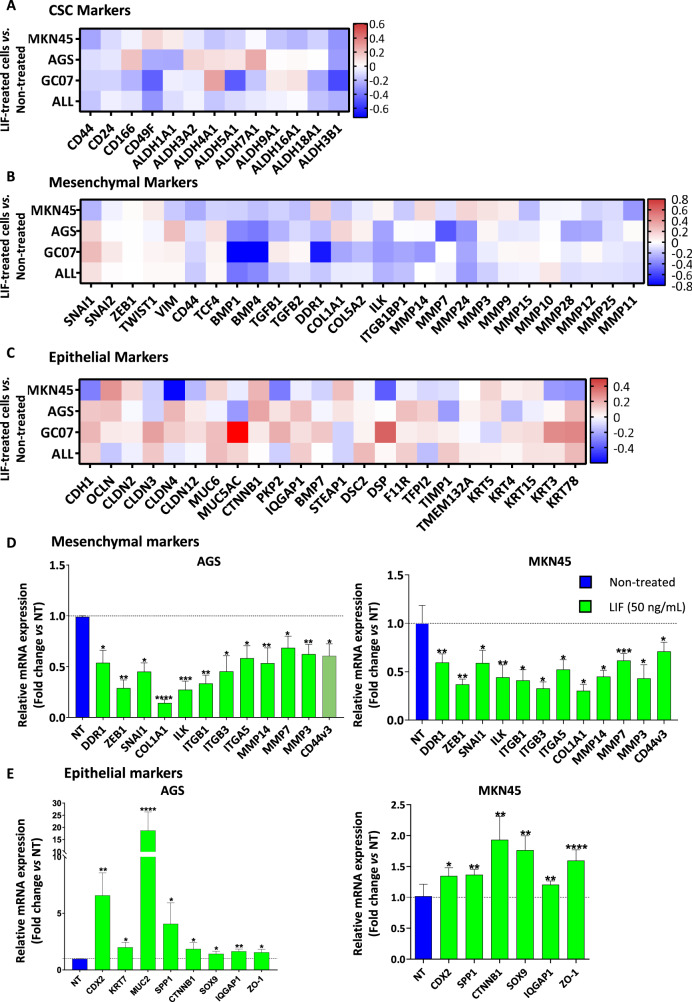
Fig. 1. Leukaemia inhibitory factor presents an EMT-inhibiting signature in GC cells.
Relative LIF-treated cells gene expression profiles showing A CSC markers, B mesenchymal markers and C epithelial markers expression in MKN45 and AGS GC cell lines and GC07 PDX cells. Agilent microarray transcriptomic analysis was carried out on LIF-treated cells compared to non-treated cells. The fourth row represents the mean expression fold change in all the cells analysed. Relative mRNA expressions of D mesenchymal and E epithelial markers, assessed by RT-qPCR, after treatment of AGS and MKN45 cells with (green) or without (blue) LIF. LIF treatments (50 ng/mL) were carried out for 48 h. Values represent fold change vs. non-treated cells, 3 < n < 4. *p < 0.05, **p < 0.005, ***p < 0.0005 and ****p < 0.0001 vs. untreated controls with ANOVA statistical analyses.

