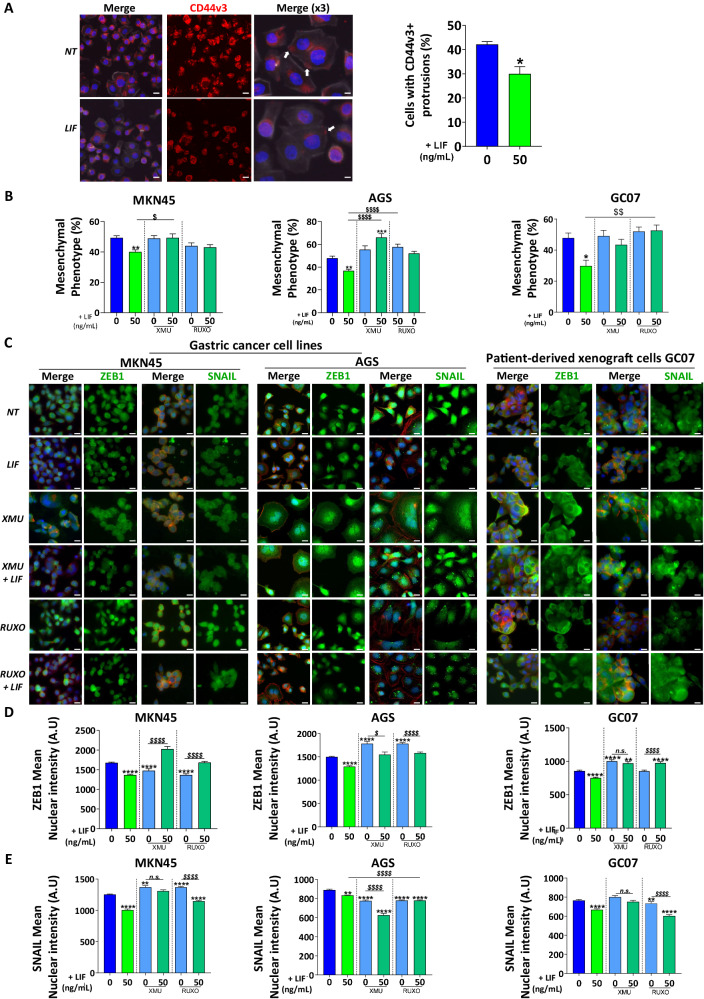
Fig. 2. Leukaemia inhibitory factor decreases EMT-associated transcription factors nuclear expression and EMT phenotype of GC cells.
A Representative immunofluorescence images of AGS GC cell lines stained with anti-CD44v3 antibody (red). Cells with CD44v3-positive cell protrusions (white arrows) were quantified. All cells were marked with phalloidin (grey) and DAPI (blue). Scale bars 10 µm. B Mesenchymal phenotype quantification of MKN45 and AGS GC cell lines and GC07 PDX cells. Quantifications were done on phalloidin-stained cells and values represent the percentage of cells with mesenchymal phenotype of n = 3 experiments ± SEM. C Representative immunofluorescence images of MKN45 and AGS GC cell lines and GC07 GC PDX cells stained with anti-ZEB1 or anti-SNAIL antibodies (green). All cells were marked with phalloidin (red) and DAPI (blue). Scale bars 10 µm. D and E Relative quantification of relative nuclear expression of ZEB1 or SNAIL in cells. Values represent mean nuclear intensity ± S.E.M., 3 < n < 4. All cells were treated with 50 ng/mL LIF (green) and/or 0.5 µM XMU-MP-1 (XMU) (emerald green) and 1 µM Ruxolitinib (emerald green) for 48 h. Inhibitors were added 30 min before LIF stimulation. *p < 0.05, **p < 0.005, ***p < 0.0005 and ****p < 0.0001 vs. untreated controls and $p < 0.05, $$p < 0.005 and $$$$p < 0.0001 vs. the conditions indicated by the bars, all with ANOVA statistical analyses.

