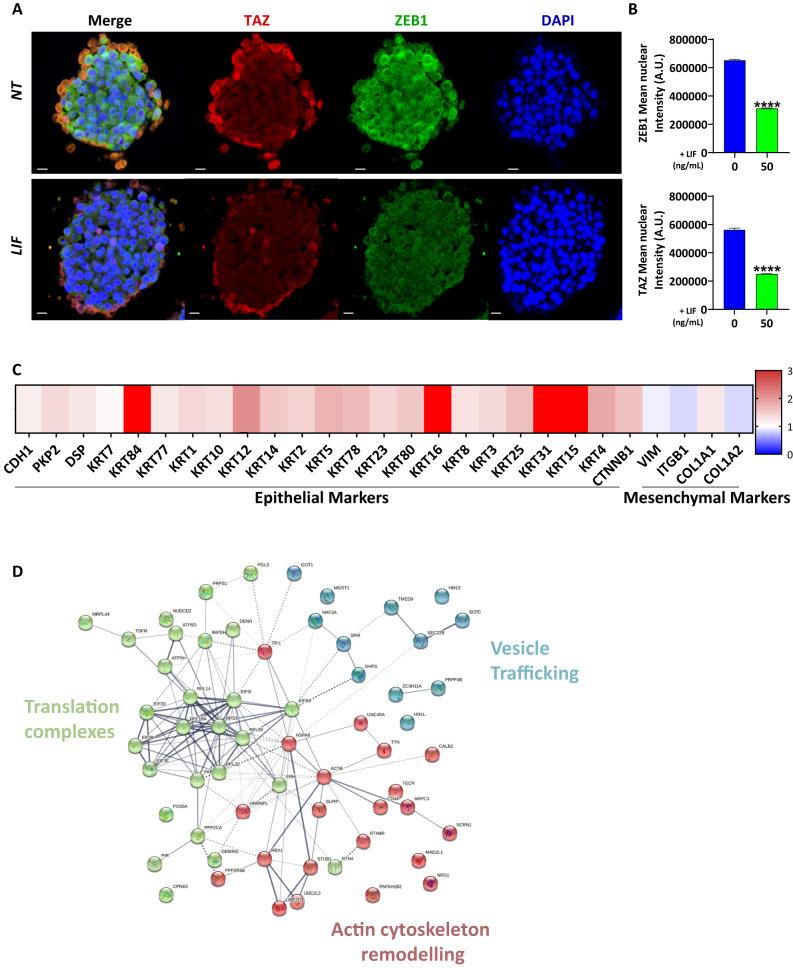
Fig. 4. Leukaemia inhibitory factor decreases EMT markers in invasive gastric CSCs.
A Representative immunofluorescent images of 3D collagen-invasion models of MKN45 GC cells stained with TAZ (red), ZEB1 (green) and DAPI (blue). B Relative quantification of cells with ZEB1 or TAZ-positive nucleus. Values represent Mean Nuclear intensity ± SEM, n = 3. C Relative protein expression profile of invasive fronts of LIF-treated spheres vs. non-treated spheres, following laser microdissection and LC–MS/MS mass spectrometry. Epithelial and mesenchymal markers are represented. D String software analysis of protein expression profile of invasive fronts of LIF-treated spheres vs. non-treated spheres. Scale bars 20 µm, ****p < 0.0001 vs. untreated controls, Mann–Whitney statistical analyses.

