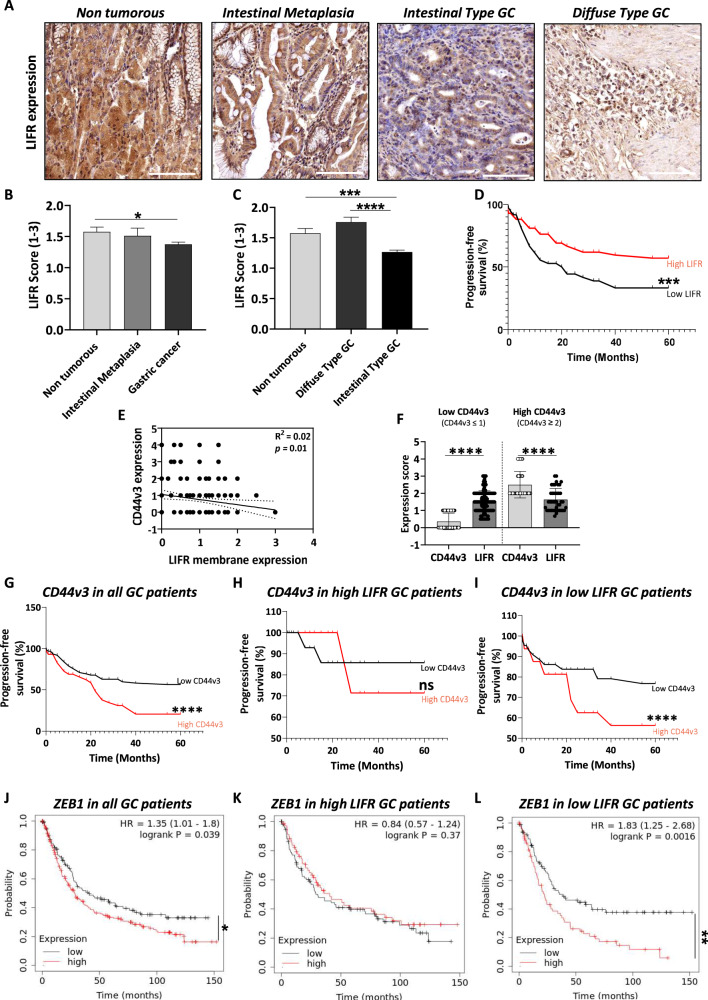
Fig. 6. Leukaemia inhibitory factor receptor is downregulated in GC.
A Representative images of the different types of TMA stained and analysed for LIFR expression (X20). Scale bars 100 µm. LIFR expression scored on TMA from GC patients. B and C Overall LIFR expression was analysed, and different comparisons were done: B Expression in Intestinal Metaplasia (n = 25) and GC (n = 146) were compared to non-tumorous tissue (n = 81), C GC was separated into the Laurèn classification-based subtypes diffuse (n = 33) and intestinal (n = 113) and compared to expression in non-tumorous tissue. Values represented mean LIFR scores according to the following criteria: 0: no expression, 1: 1–20%, 2: 20–50%, 3: >50. D Progression-free survival curves showing patients’ survival percentage according to overall LIFR low expression (LIFR ≤ 1, n = 40) and high expression (LIFR > 1, n = 68). E Correlation analysis of CD44v3 and LIFR-membrane expression scores (n = 133). F Expression scores of CD44v3 and LIFR in tumours having low CD44v3 (CD44v3 ≤ 1, n = 92) and high CD44v3 expression (CD44v3 ≥ 2, n = 42). G–I Progression-free survival curves showing survival percentage of GC patients (14 ≤ n ≤ 69) according to G CD44v3 expression in all patients independent of LIFR expression profile; H CD44v3 expression in patients having high LIFR expression; I CD44v3 expression in patients having low LIFR expression. Red bars represent high CD44v3 expression and black bars have low CD44v3 expression. J–L KMplot database analyses showing overall survival probability of GC patients (69 ≤ n ≤ 249) according to J ZEB1 expression in all patients independent of LIFR expression profile; K ZEB1 expression in patients having high LIFR expression; L ZEB1 expression in patients having low LIFR expression. Red bars represent high ZEB1 expression and black bars have low ZEB1 expression. *p < 0.05, **p < 0.005, ***p < 0.0005 and ****p < 0.0001 vs. the conditions indicated by the bars, ANOVA, Wilcoxon paired t-test statistical analyses, paired t-test and log-rank test.

