
Fig. 1. Impact of SARS-CoV-2 S1 and NP on Mo subset differentiation and activation.
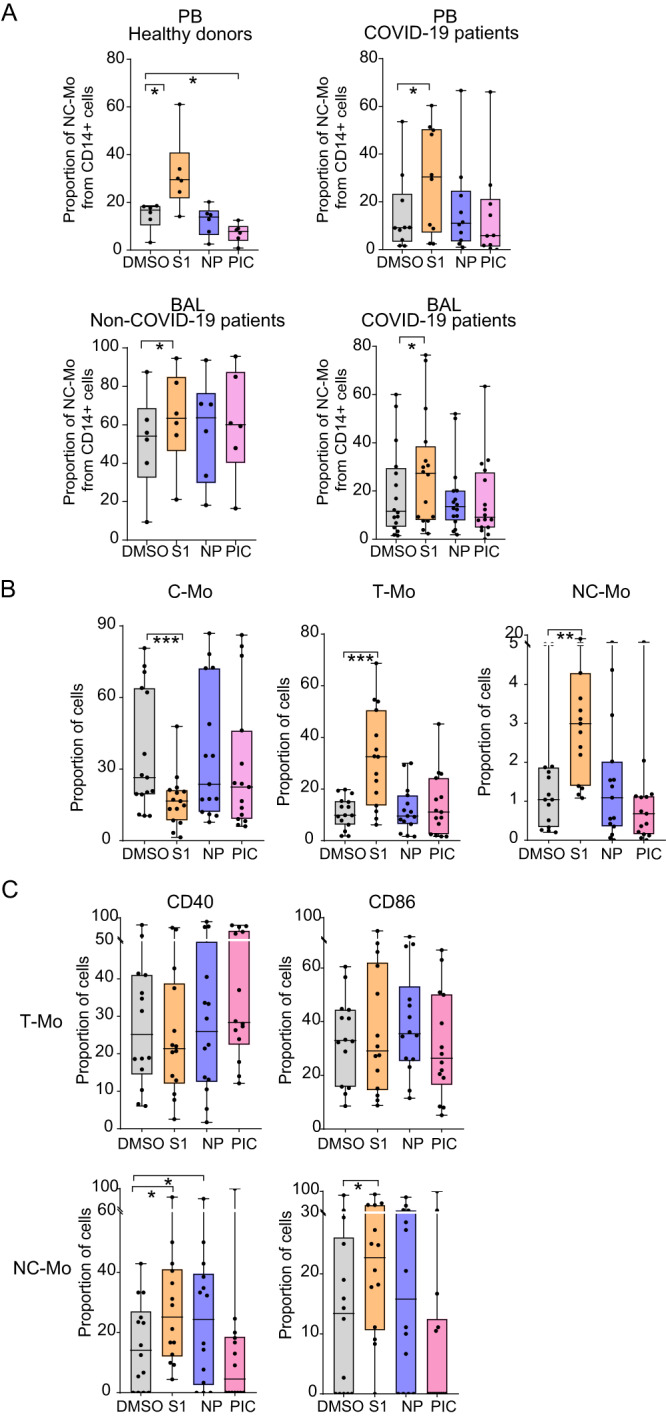
A, B Proportions of Non-classical (NC-Mo, A–C), Transitional (T-Mo; B, C) and classical (C-Mo, B) Mo in bulk cultures (A) of PBMC of healthy donors (n = 6) (left upper A) (p = 0.0313; 0.0313), COVID-19 patients (n = 10) (right upper A) (p = 0.0322) and of lung infiltrates (BAL) from control non-COVID-19 (n = 6) (lower left A) (p = 0.0313) and severe COVID-19 patients (n = 16) (lower right A) (p = 0.0110) or in pre-isolated Mo (n = 15) (B) cultured in the presence of DMSO (gray), S1 peptide (orange), NP peptide (purple) and Poly I:C (PIC, pink) (p = 0.0001; 0.0001; 0.0042). C proportions of CD40+ (left) and CD86+ (right) cells included in the T-Mo subset (upper plots; n = 15) and in the NC-Mo subset (lower plots; n = 14) from each culture condition (p = 0.0200; 0.0322; 0.0479). Data are represented as box and whiskers with bars representing maximum and minimum values and with median highlighted as a line. Statistical significance was calculated using a one-tailed (A upper right) or two-tailed (rest of plots) Wilcoxon tests: *p < 0.05, **p < 0.01, ***p < 0.001.