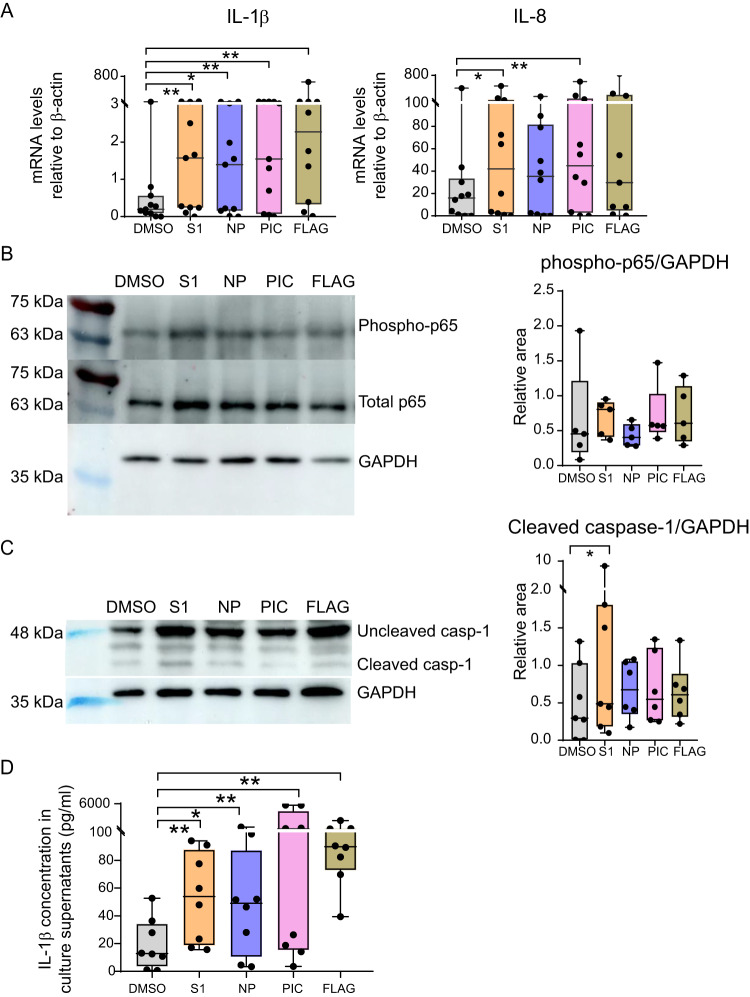
Fig. 2. Analysis of proinflammatory cytokine expression and activation of NFκB and Caspase 1 pathways in Mo exposed to SARS-CoV-2 proteins and TLR ligands.
Analysis of mRNA levels (A) quantified by RT-qPCR of IL-1β (n = 11) (left) (p = 0.0049; 0.0420; 0.0049; 0.0059) and IL-8 (n = 10) (right) (p = 0.0371; 0.0098) normalized to β-actin mRNA expression and (D) ELISA quantification of concentration (pg/mL) of secreted active IL-1β protein in culture supernatants of Mo isolated from healthy donors stimulated with DMSO or S1 peptide (orange), NP peptide (purple), Poly I:C (PIC, pink) and Flagellin (FLAG, khaki) (n = 8) (p = 0.0078; 0.0391; 0.0078; 0.0078). Western blot analysis of phosphorylated and total NFκB p65 subunit (B) and uncleaved versus cleaved caspase 1 (C) in Mo cultured in the presence of DMSO and 3 h (p65) or 16 h (caspase 1) after stimulation with SARS-CoV-2 S1, NP peptides or TLR ligands. GAPDH was included as a loading control and used for normalization purposes. Quantification of phosphorylated p65 (B; n = 5) and cleaved caspase 1 (C; n = 7) (p = 0.0313) normalized to GAPDH are shown on the right of each panel. Statistical analyses in A, C, D were performed using a two-tailed Wilcoxon test: *p < 0.05, **p < 0.01. Data are represented as box and whiskers with bars representing maximum and minimum values and with median highlighted as a line.

