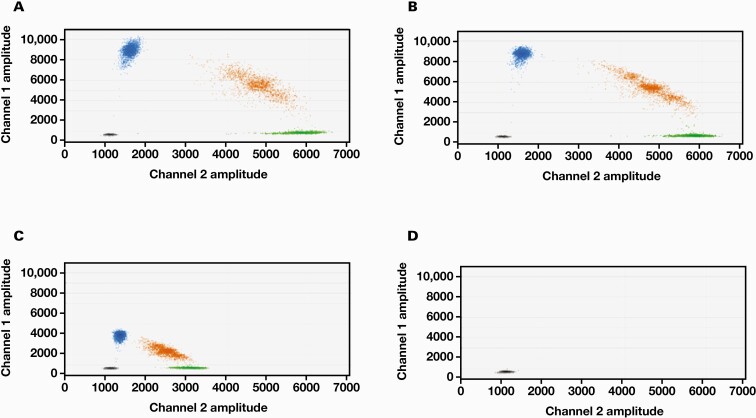
Figure 1.
Optimization of annealing temperature for determination of mitochondrial DNA m.3243A>G heteroplasmy levels using droplet digital polymerase chain reaction (ddPCR). A 1:1 mixture of wild-type (WT) and mutant plasmids was subjected to ddPCR assay. A, 50°C. B, 55°C. C, 60°C. D, 65°C. Vertical axis shows the fluorescence intensity of FAM (channel 1) and the mutant probe and horizontal axis shows the fluorescence intensity of HEX (channel 2) and the WT probe. Blue, green, and orange dots indicate positive droplets only, for the mutant, WT, and both the probes, respectively. Black dots indicate negative droplets for both the probes.

