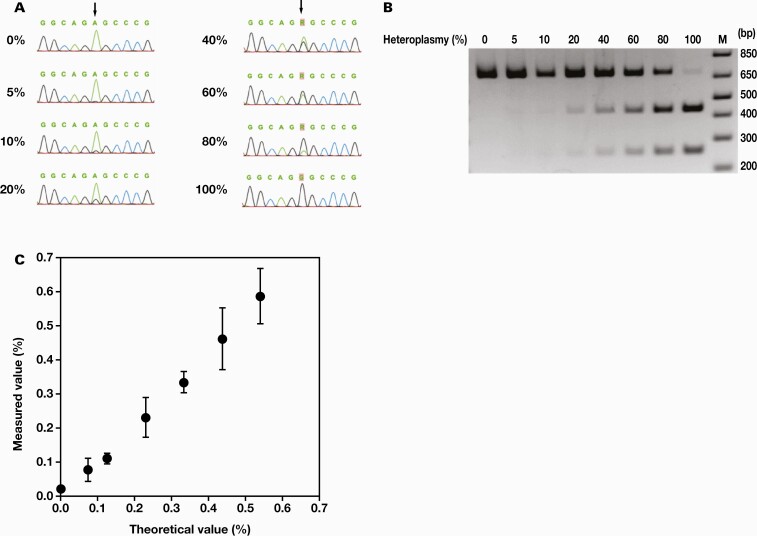
Figure 3.
Lower limit of detection of m.3243A>G mutation. Polymerase chain reaction (PCR) products amplified from a mixture of wild-type and mutant controls in various proportions were subjected to direct Sanger sequencing (A), PCR-restriction fragment length polymorphism (B), and drop digital PCR (C). A, Chromatograms of the sequences in various heteroplasmy levels are shown, and arrows indicate the position of m.3243. The lower limit of detection was 10%, which was the point at and before which the G-peak was not visible. B, The 692 bp PCR products were electrophoresed as described in the “Material and Methods” section. The mutated DNA was digested into 433 and 259 bp fragments. The lower limit of detection was 10%, which was the point at and before which neither of the 2 bands could be identified. M indicates a DNA ladder. Numbers on the right are the sizes (in bp) of the DNA ladder components. C, Error bars represent the mean ±2.6 SD (n = 5). The lower limit of detection was 0.08%, which is the minimum value at which +2.6 SD of the mean of the theoretical value of 0% did not overlap with -2.6 SD of the measured value.

