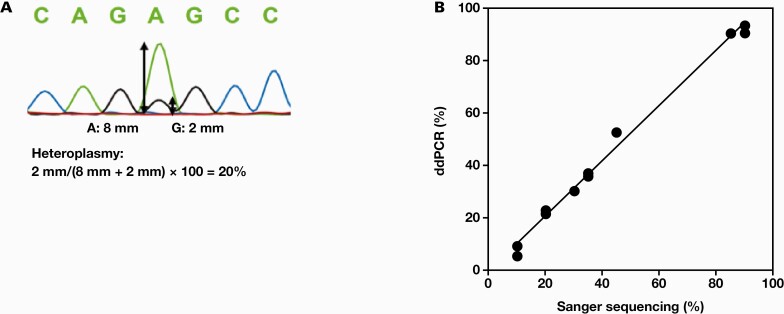
Figure 4.
Correlation between Sanger sequencing and drop digital polymerase chain reaction (ddPCR). A, Heteroplasmy levels in Sanger sequencing were calculated from ratio of the heights of A and G peaks. B, Heteroplasmy levels were measured using Sanger sequencing and ddPCR using DNA extracted from peripheral blood of patients harboring m.3243A>G mutation (y = 1.05x – 0.016; R2 = 0.993).

