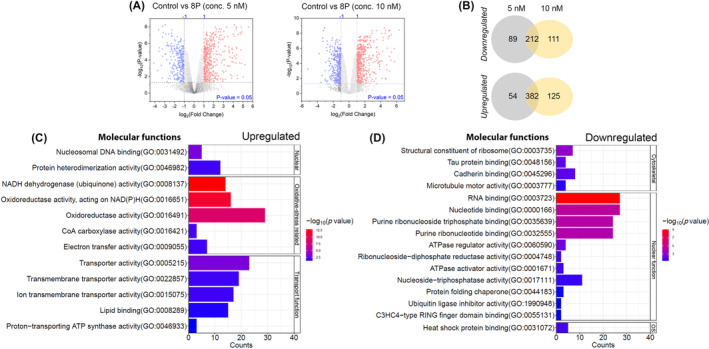
FIGURE 5.

(A) Volcano plots represent differential upregulation (red) and downregulation (blue) of the proteins in MOLM‐13 cells treated with RET/CDK8i at 5 nM or 10 nM. (B) Venn diagram representing the differentially expressed proteins in cells mutually inclusive or exclusive at the concentrations of RET/CDK8i used. Several signaling pathways were predicted based on the enrichment of molecular functions of differentially (C) upregulated or (D) downregulated proteins.
