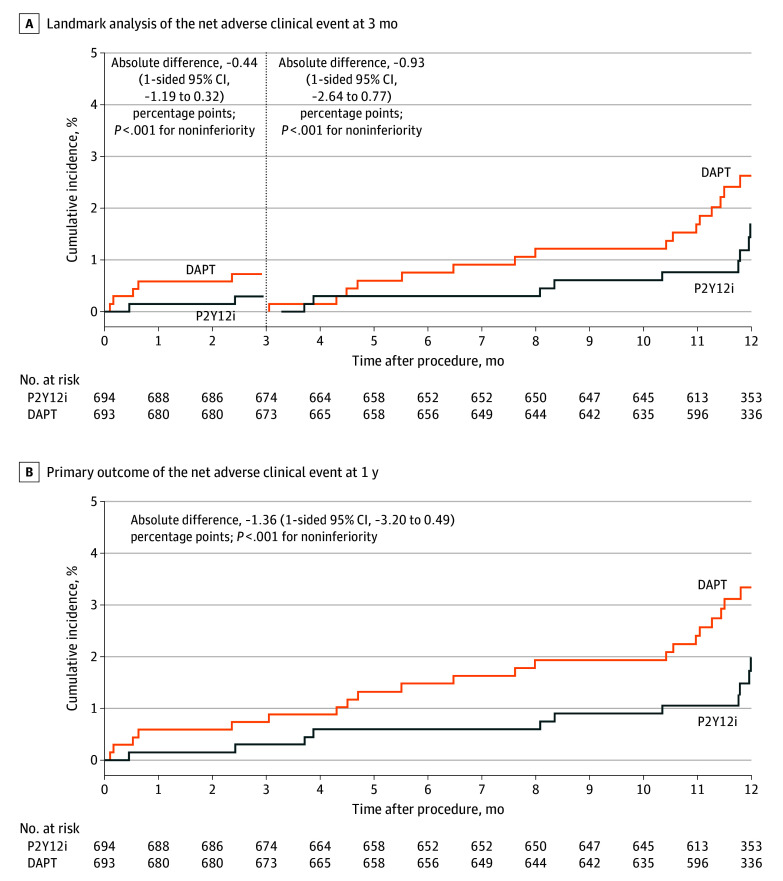
Figure 2. Time-to-Event Curves for the Primary Outcomes.
A net adverse clinical event was defined as a composite of major bleeding (based on Bleeding Academic Research Consortium type 3 or type 5 bleeding) or major adverse cardiac and cerebrovascular events. Event rates were based on Kaplan-Meier estimates in time-to-first-event analyses. Vertical dashed line indicates 3-month point (after which 1 group received P2Y12 inhibitor monotherapy [P2Y12i] and the other received dual antiplatelet therapy [DAPT]).

