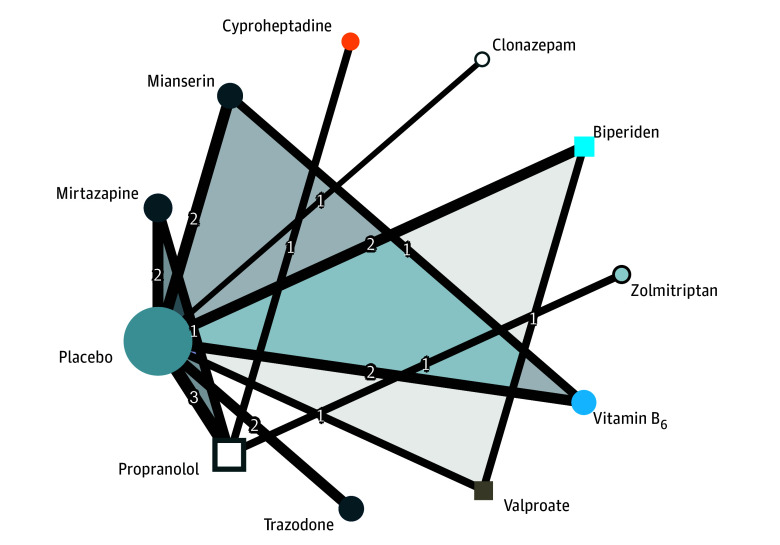
Figure 3. Network Graph for Main Results of Meta-Analysis.
Node size is proportional to the total number of patients for each intervention. Line thickness is proportional to weight from the random-effects model. The number overlying the lines is equal to the number of studies corresponding to the comparison. Triangles represent comparisons for 3-arm studies. Colors of the nodes represent the therapeutic classes of intervention: β-blocker (propranolol), antidepressant (mirtazapine, mianserin, and trazodone), mood stabilizer (valproate), anticholinergic (biperiden), antihistaminic (cyproheptadine), benzodiazepine (clonazepam), and triptan (zolmitriptan).

