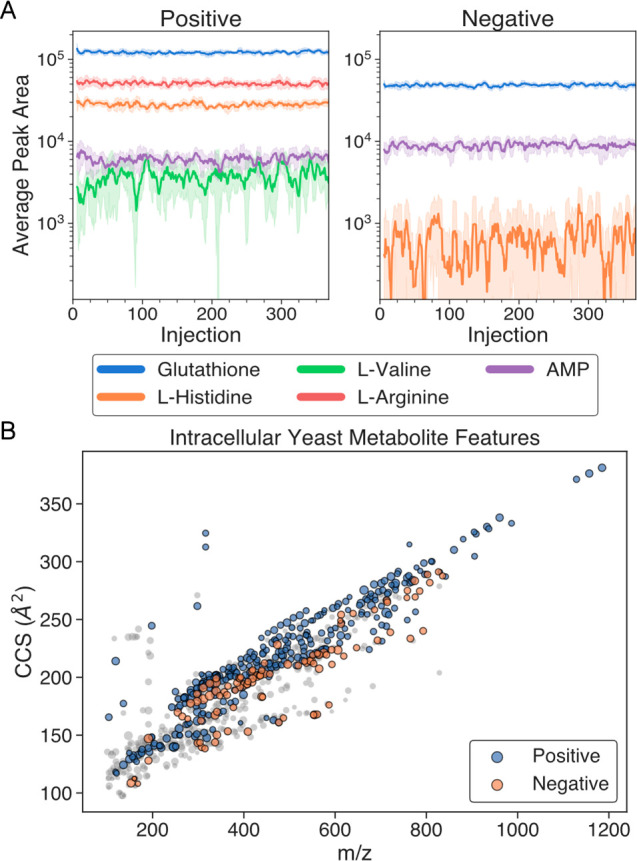
Figure 3.

Automated analysis of the extracted intracellular yeast samples with AutonoMS. (A) Detected peak areas in extracted yeast samples across plate injections (368 over 38 min per mode) of the 5 ions used in the chemical standards analysis. Ions correspond to the [M + H]+ and [M – H]− adducts in positive and negative modes, respectively. Peak areas shown as the 6-injection moving average (solid lines) together with 6-injection standard deviation (shaded areas). (B) Untargeted metabolite features found across all extracted yeast samples across positive (blue) and negative (orange) ionization modes. Displayed features were present in at least 2/3 of samples in a given mode and had Agilent quality scores greater than 70. A total of 812 features were found, of which 404 involved multiple ions in various ionization states. Single ionization state (z = 1) ion features are shown in gray, and marker size is scaled according to log10(abundance).
