
Figure 3.
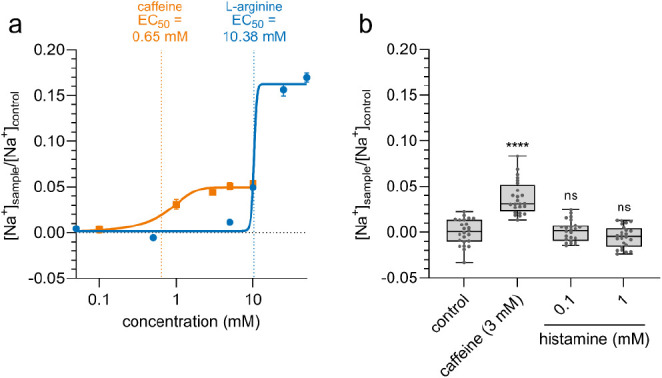
(a) Caffeine and l-arginine lead to a concentration-dependent Na+ influx into HGT-1 cells. For caffeine, the EC50 is reached at 0.65 mM, whereas the EC50 of l-arginine is 10.38 mM. (b) Treatment of cells with caffeine (3 mM) increases intracellular Na+ concentrations compared to untreated control cells. However, the Na+ concentration of histamine-treated cells (0.1 or 1 mM) does not differ from untreated cells. Statistics: n = 4, t. r. = 6, one-way ANOVA Holm-Šidák post hoc test; significant differences are expressed with ****p ≤ 0.0001.