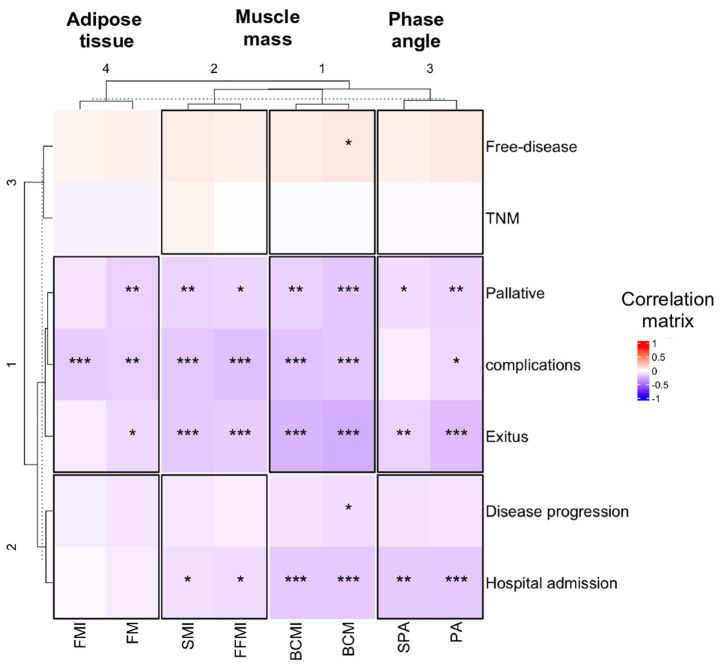
Figure 1.
Correlation plots are presented to show the association between body composition (X-axis) and cancer complications related to head and neck cancer (Y-axis) of all participants. Pearson’s correlation coefficient was used, and an asterisk indicates a significant correlation between variables according to Pearson’s correlation test (*p < 0.05; **p < 0.01 and ***p < 0.001). BCM, body cell mass; BCMI, BCM index; FFMI, fat-free mass index; FM, fat mass; FMI, FM index; OR, odds ratio; PA, phase angle; SMI, skeletal muscle index; SPA, standardized PA.

