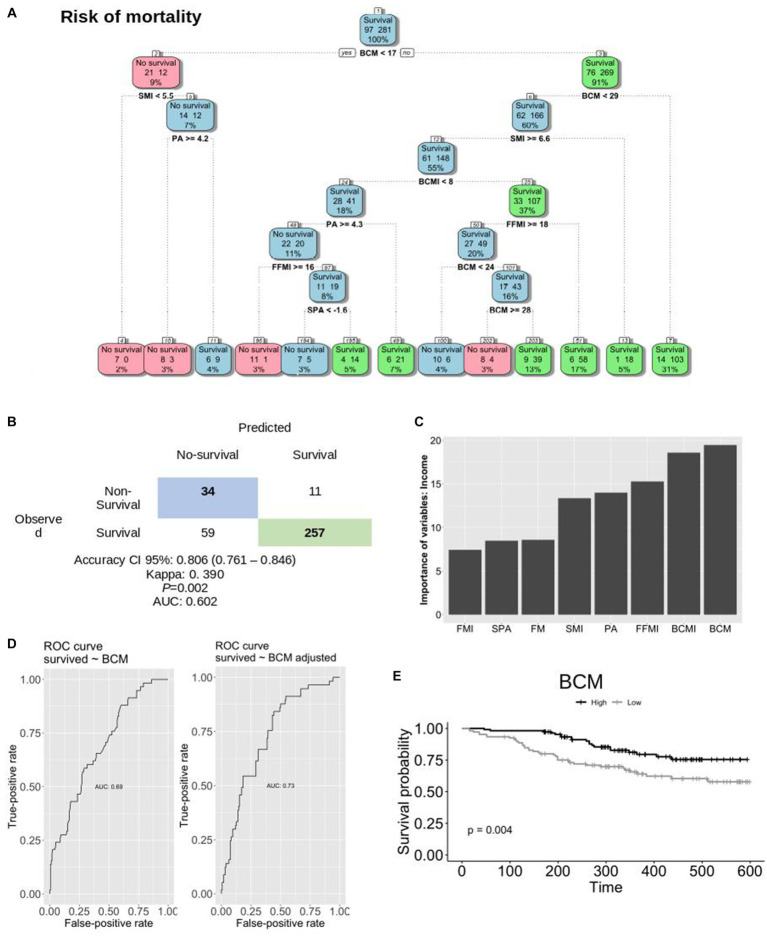
Figure 2.
Random forest and decision tree of variables to predict mortality. (A) Decision tree performed with the most important variable in the model. Numbers inside the boxes indicate as follows: the left number represents the count of patients predicted as positive by the model; the right number represents the count of patients predicted as negative. The percentage indicates the proportion of individuals included in the model (B). Table to calculate the accuracy of the model (C). Quantitative contribution of each variable included in the analysis (D). The ROC curve of BCM and adjusted BCM to predict survival (E). The predictive model of BCM on survival in HNC patients. AUC, area under the curve; BCM, body cell mass; BCMI, BCM index; FFMI, fat-free mass index; FM, fat mass; FMI, FM index; OR, odds ratio; PA, phase angle; SMI, skeletal muscle index; SPA, standardized PA.

