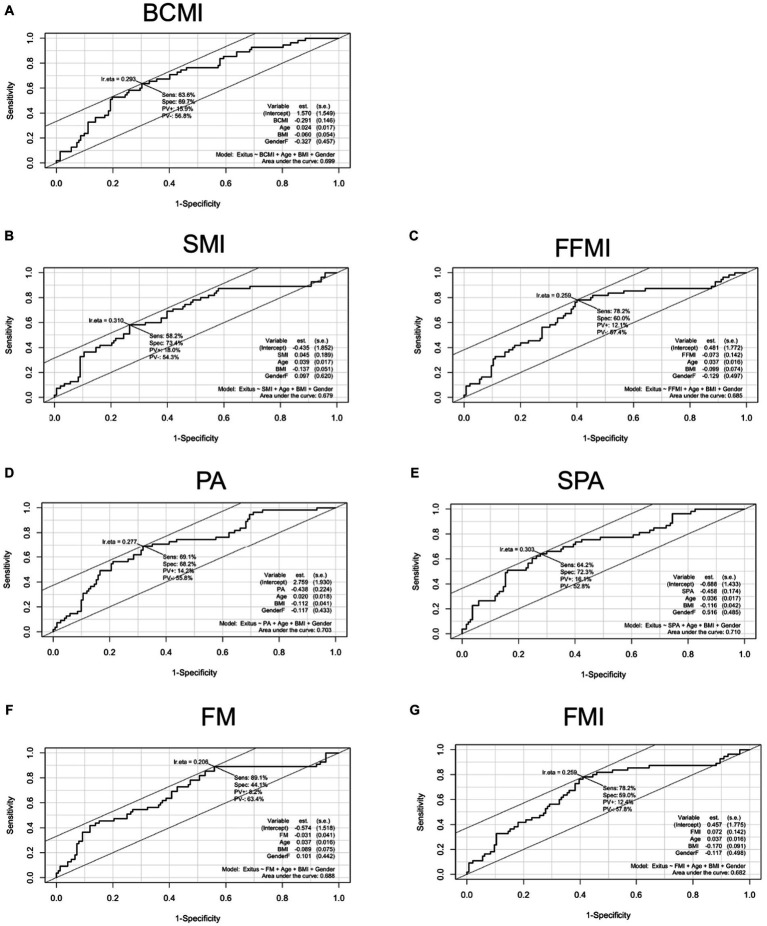
Figure 3.
The AUC showing the predictive model of the main BIA variables, adjusted by age, sex, and BMI. (A) AUC body cell mass index. (B) AUC skeletal mass index; (C) AUC fat-free mass index. (D) AUC phase angle. (E): AUC standardized phase angle. (F) AUC fat mass. (G). AUC fat mass index. AUC, area under the curve; BCM, body cell mass; BCMI, BCM index; FFMI, fat-free mass index; FM, fat mass; FMI, FM index; OR, odds ratio; PA, phase angle; SMI, skeletal muscle index; SPA, standardized PA.

