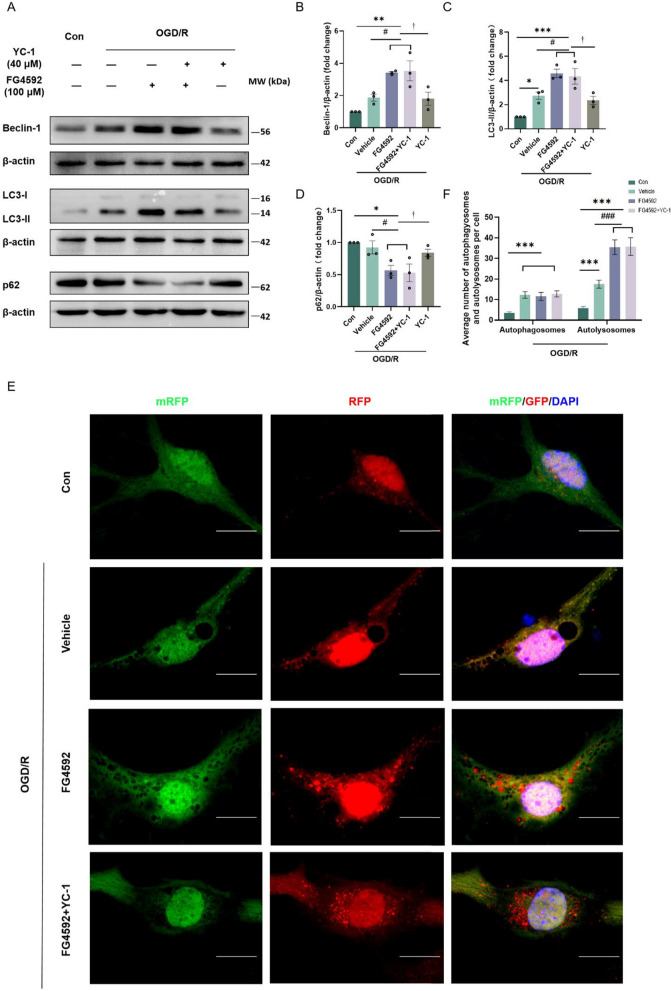
Fig. 8.
FG4592 activates autophagy flux in a HIF-1α independent way in primary cortical neurons. A Western blots analysis of autophagic proteins in the primary cortical neurons, including Beclin-1, LC3-II and p62/SQSTM1. Cells of YC-1 groups were first pretreated with YC-1 for 1 hour. All experimental groups were dealt with OGD for 3 hours and then treated with vehicle or FG4592 after reperfusion. B-D The bar graphs of western blot data in panel A. β-actin was used as a loading control. Data are presented as mean ± SEM, Con vs other groups: ***p < 0.001, **p < 0.01, *p < 0.05. vehicle vs FG4592 or FG4592+YC-1: #p < 0.05. YC-1 vs FG4592 or FG4592+YC-1: †p < 0.05 (one-way ANOVA followed by Dunnett’s post-hoc test, n = 3). E Representative confocal microscopy images correspond to the autophagic flux analysis for primary cortical neurons. Primary cortical neurons were transfected with mRFP-GFP-MAP1LC3B adenovirus for 4 days. Cells of the YC-1 group were pretreated with YC-1 for 1 hour. All experimental groups were dealt with OGD and then treated with vehicle or FG4592 after reperfusion. Scale bar = 10 μm, 100×. F The number of yellow (autophagosomes) and red (autolysosomes) puncta were counted. Data represented as mean ± SEM from three independent coverslips. Con vs other groups: ***p < 0.001, vehicle vs FG4592 or FG4592+YC-1: ###p < 0.001 (one-way ANOVA followed by Dunnett’s post-hoc test, n = 40 neurons in each group)

