
Fig. 1.
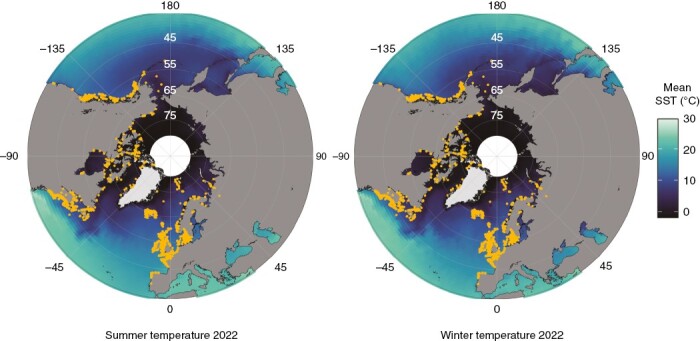
The worldwide distribution of Saccharina latissima. Occurrence data of S. latissima (orange dots) were collected from databases [Global Biodiversity Information Facility (www.gbif.org) and the Ocean Biogeographic Information System (http://iobis.org)]. Occurrence data cover the time frame between 1903 and 2020. Note that the points size is increased to allow visualization at this large scale and does not display the real areal extent Sea surface temperature data (colour gradient) from 2022 [left panel, summer temperature (21 March to 21 September 2022); and right panel, winter temperature (1 January to 21 March 2022 and 21 September to 31 December 2022)] were downloaded from the NOAA database (https://coastwatch.pfeg.noaa.gov/erddap/). The maps integrate the monthly temperature mean with latitude and longitude averaged as integers. There are white areas around the North Pole, where the projection makes data interpolation impossible. Maps were created with the R package ggOceanMaps (Vihtakari, 2022).