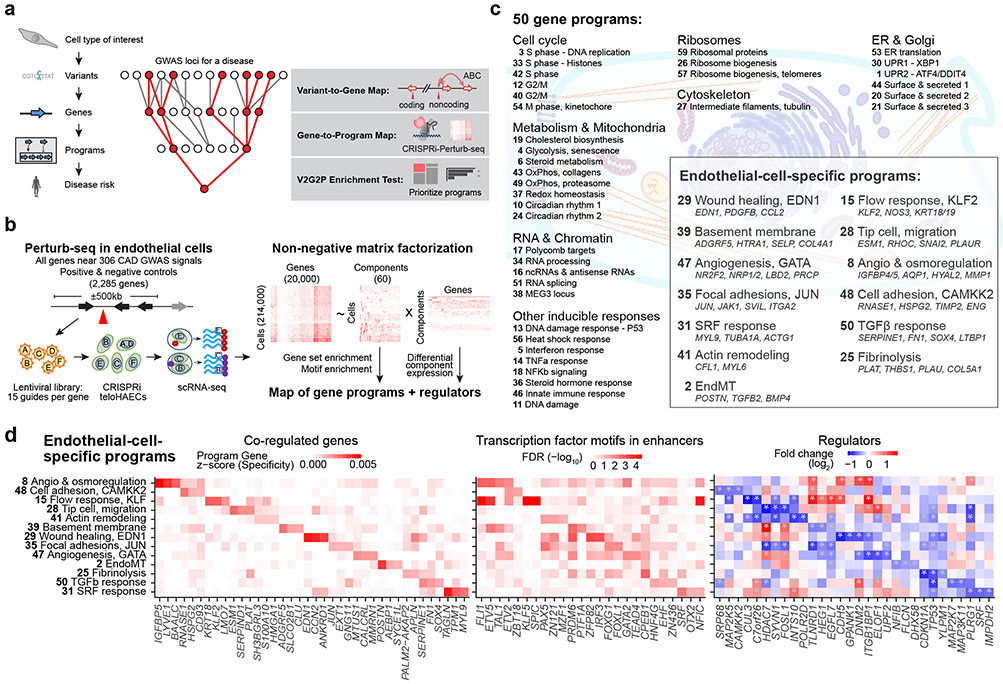
Fig. 1. Building a map of gene programs in endothelial cells using Perturb-seq.
a. Overview of the Variant-to-Gene-to-Program (V2G2P) approach. Red nodes outline an example of the predicted convergence of multiple risk variants onto a small number of cell type-specific programs related to disease.
b. Diagram of the approach to create a map of gene programs and regulators using Perturb-seq (Gene to Program, G2P).
c. 50 gene programs were identified de novo from Perturb-seq and cNMF. For the 13 EC-specific programs, selected co-regulated genes in the program are shown in italics.
d. EC-Specific Programs. Heatmaps show, for each program, the top 3 program co-regulated genes (left, ranked by specificity to the program, see Methods); the top 3 transcription factor motifs in enhancers (middle, ranked by enrichment FDR); and top 3 regulators (right, ranked by fold-change in component expression upon perturbation; see also Extended Data Fig. 3e).

