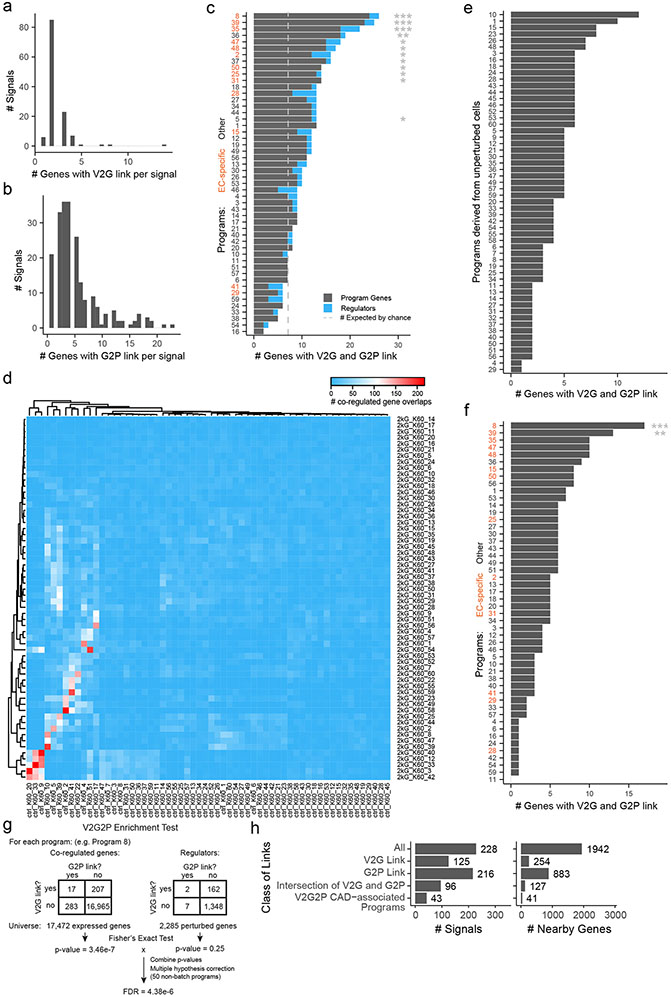
Extended Data Fig. 6. Details for V2G2P analysis.
a. Number of genes with V2G links, per non-lipid CAD GWAS signal.
b. Number of genes with G2P links, per non-lipid CAD GWAS signal.
c. The cell-type specificity of V2G links appeared to be important for identifying endothelial-cell-specific programs. Here, we repeated the V2G2P analysis (as outlined in Fig 2), but linked variants to genes using cell-type-agnostic criteria (including ABC scores from any cell type and not just endothelial cells). The 50 programs are ordered (y-axis) by the number of program genes linked to CAD variants (x-axis). Gray dashed line: the number of genes linked to CAD variants that would be expected by chance. Orange labels: endothelial-cell-specific programs. Two significant non-endothelial-cell-specific programs were identified. Fisher exact test with FDR correction, as outlined in panel g. (*FDR <0.05, **FDR <0.005, ***FDR <5e-4)
d. Number of overlapping co-regulated genes between control programs (ctrl, x-axis) and full library (2kG, y-axis) programs.
e. Using the full Perturb-seq dataset appeared to be important for identifying the 5 CAD-associated programs. Programs discovered through cNMF analysis of only the “unperturbed” cells carrying negative control guideRNAs. In this version of the analysis, none of the programs are enriched for genes with V2G link. Fisher exact test with FDR correction, see procedure in panel g. (All programs have FDR > 0.05).
f. Enrichment of genes with V2G links, from the full library but only using co-regulated genes (not regulators,***: FDR < 0.0005, **: FDR < 0.005)
g. Steps of V2G2P enrichment test. Numbers shown as examples are from program 8.
h. V2G2P analysis prioritizes a small subset of genes and GWAS signals compared to either V2G or G2P information alone. Barplots: Counts for signals (left) or nearby genes (right), total (“All”) or those that have: a V2G link, a G2P link, both a V2G link and G2P link to any program, or both a V2G link and a G2P link to a significantly enriched V2G2P program.

