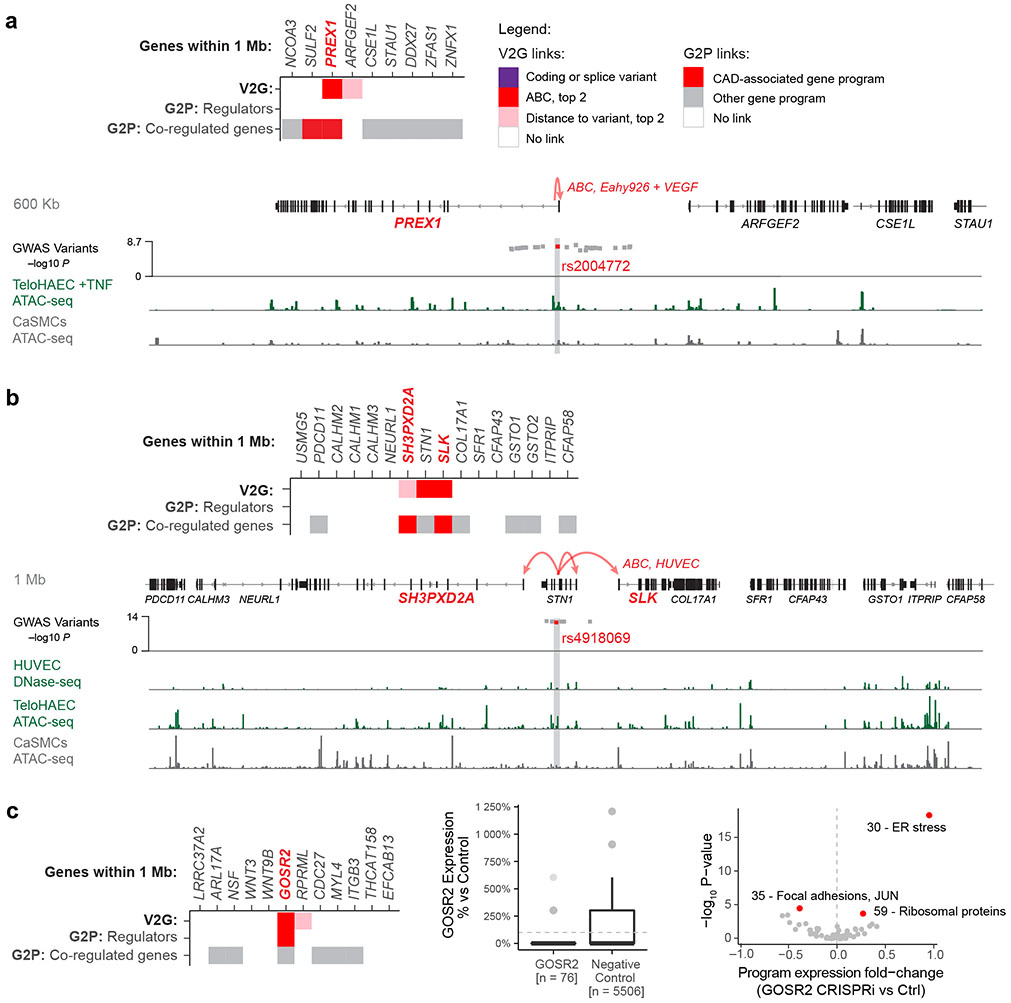
Extended Data Fig. 7. Variant-to-gene to program links refine causal gene predictions.
a. V2G2P evidence at the 20p13.1 CAD GWAS locus. Top: Heatmap lists genes within 1 Mb of the CAD GWAS signal in genomic order, and shows variant-to-gene (V2G) and gene-to-pathway (G2P) evidence, with the prioritized CAD-associated V2G2P gene(s) labeled in red bold font. Legend details: “ABC, top 2”: A noncoding variant overlaps a chromatin accessible peak in endothelial cells, and the ABC score is at least the second highest of all genes near the GWAS signal. “Distance to variant, top 2”: A noncoding variant overlaps a chromatin accessible peak in endothelial cells, and the gene is one of the two closest genes to the variant. Bottom: Zoom-in on genes near the CAD GWAS signal, where rs2004772 is predicted by ABC to regulate PREX1 in the Eahy926 endothelial cell line treated with VEGF. Red dot: Prioritized variant in predicted enhancer. Gray dots: Other variants within R2 < 0.9 of the lead variant in the locus. Signal tracks below show ATAC-seq or DNase-seq for endothelial and coronary artery smooth muscle cells (CaSMCs, another cell type relevant to CAD).
b. As per a, showing V2G2P evidence at the 10p24.33 CAD GWAS signal, where three genes had V2G links (to an enhancer containing rs4918069) and 2 had gene to CAD-associated program links. HUVEC: human umbilical vein endothelial cells.
c. V2G2P evidence at the 17q21.3 CAD GWAS locus, where we have previously linked rs17608766 to GOSR2129. Heatmap, as in panel (a). Middle: Box plot of GOSR2 reads per cell, normalized to control cell average. n: number of cells. Dotted line: control average (100%). Boxplot center line, median; box limits, upper and lower quartiles; whiskers, 1.5x interquartile range; points, outliers. Counts for outliers, from top to bottom: GOSR2; 1 & 17, Control; 4 & 15. Right: Volcano plot shows effect of GOSR2 knockdown in Perturb-seq on the expression of the 50 non-batch gene programs. Red: FDR < 0.05, from two-sided statistical tests on program expression between perturbed vs. control cells by the MAST package39.

