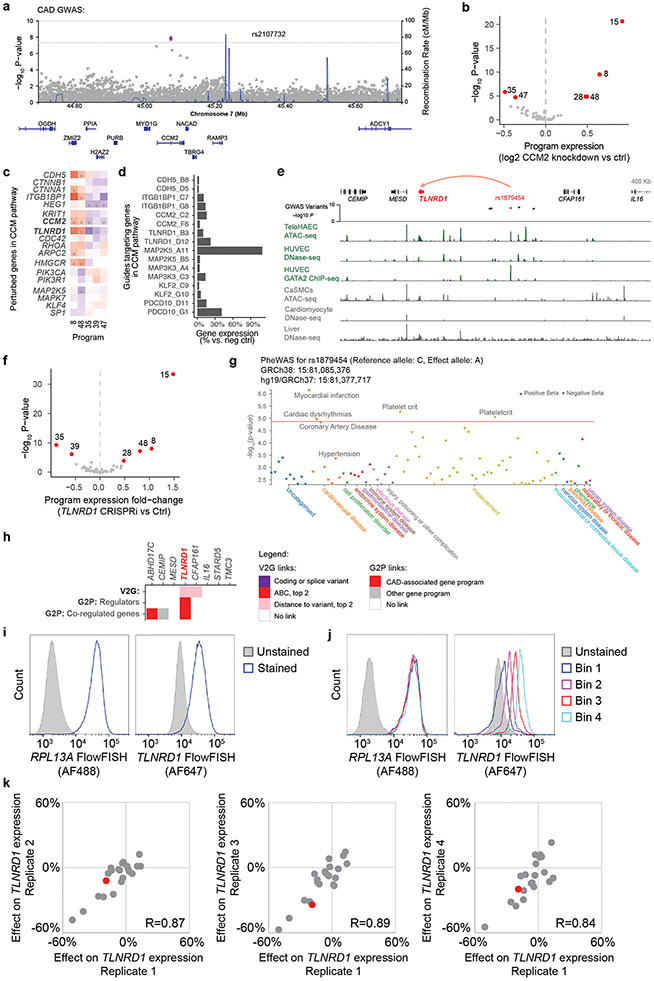
Extended Data Fig. 8. Regulatory connections amongst perturbed genes and the CCM pathway, and variant-to-gene links to TLNRD1.
a. Locus zoom plot (http://locuszoom.org/) for CAD GWAS in a 1-Mb region around CCM2. P.values are from the joint association analysis in Aragam et al. 12.
b. Volcano plot showing effect of CCM2 knockdown in Perturb-seq on the expression of the 50 programs. Red: FDR < 0.05. Significance was assessed by two-sided statistical test on program expression between perturbed vs. control cells by the MAST package39.
c. Effects of selected perturbed genes on CAD-associated programs (Same as Fig. 3b, with significant effects marked with a * (FDR < 0.05)). Color scale: log2 fold-change on program expression in Perturb-seq. Bold text: CAD-associated V2G2P genes.
d. Knockdown efficiency for genes in the CCM pathway, in bulk RNA-seq (Fig. 3c). x-axis: Gene expression for each target gene in cells receiving target guides, vs. cells with control guides. y-axis: guide IDs for CCM pathway genes.
e. 15q25.1 CAD risk locus, where rs1879454 is predicted to regulate TLNRD1 (red arc). GWAS variants: −log10 GWAS P-value12 for variants with LD R2 > 0.9 with the lead SNP. Green signal tracks: Epigenomic data from ECs. Gray signal tracks: data from other cell types. HUVEC: human umbilical vein ECs. CaSMCs: coronary artery smooth muscle cells.
f. Volcano plot showing the effect of TLNRD1 knockdown in Perturb-seq on the expression of the 50 programs. Red: FDR < 0.05. Statistical test as per (b).
g. Phenome-wide association study (PheWAS) for rs1879454, from Open Targets98,151. P.values are the best GWAS p.values for association of this variant with each trait across all GWAS sources used by Open Targets (February 25, 2022 release), including UKBB. Orange line: p.value required for significance across all traits. No lipid measure met the p.value threshold for inclusion in the plot, of 0.005. Note: The p.value for CAD is higher than that observed in Aragam et al.12 because Open Targets does not currently contain summary statistics for the latest CAD GWAS. There were no measures of circulating lipids or blood pressure associated with this GWAS signal in a PheWAS analysis in Aragam et al.12.
h. Variant-to-gene-to-program evidence at the 15q25.1 CAD GWAS locus. Heatmap shows variant-to-gene (V2G) and gene-to-pathway (G2P) evidence for all genes within 1 Mb of the CAD GWAS signal, in genomic order, with the CAD-associated V2G2P gene labeled in red bold font. Legend details: “ABC, top 2”: A noncoding variant overlaps a predicted enhancer linked to this gene in endothelial cells, and ABC score is at least the second highest of all genes in the locus. “Distance to variant, top 2”: A noncoding variant overlaps a chromatin accessible peak near this gene in endothelial cells, and the gene is one of the two closest genes to the peak. “CAD-associated gene programs” are the 5 V2G2P programs: 8, 35, 39, 47, 48.
i. Histograms of FlowFISH signal (arbitrary units of fluorescence) for RPL13A (left) and TLNRD1 (right) in unstained versus stained teloHAEC expressing the gRNA pool against promoter and potential enhancers. The complete FlowFISH data can be found in Supplementary Table 28.
j. As in (d), but showing the RPL13A (left) and TLNRD1 (right) signal after sorting of cells into 4 bins based on expression of TLNRD1. Results are typical of cells across the 4 independent samples.
k. Scatter plots showing the strong correlation between effects on TLNRD1 gene expression for all E-G pairs measured in each of 4 independent CRISPRi-FlowFISH screens. The enhancer containing rs1879454 is colored in red, all others in gray. R: Pearson correlation coefficient.

