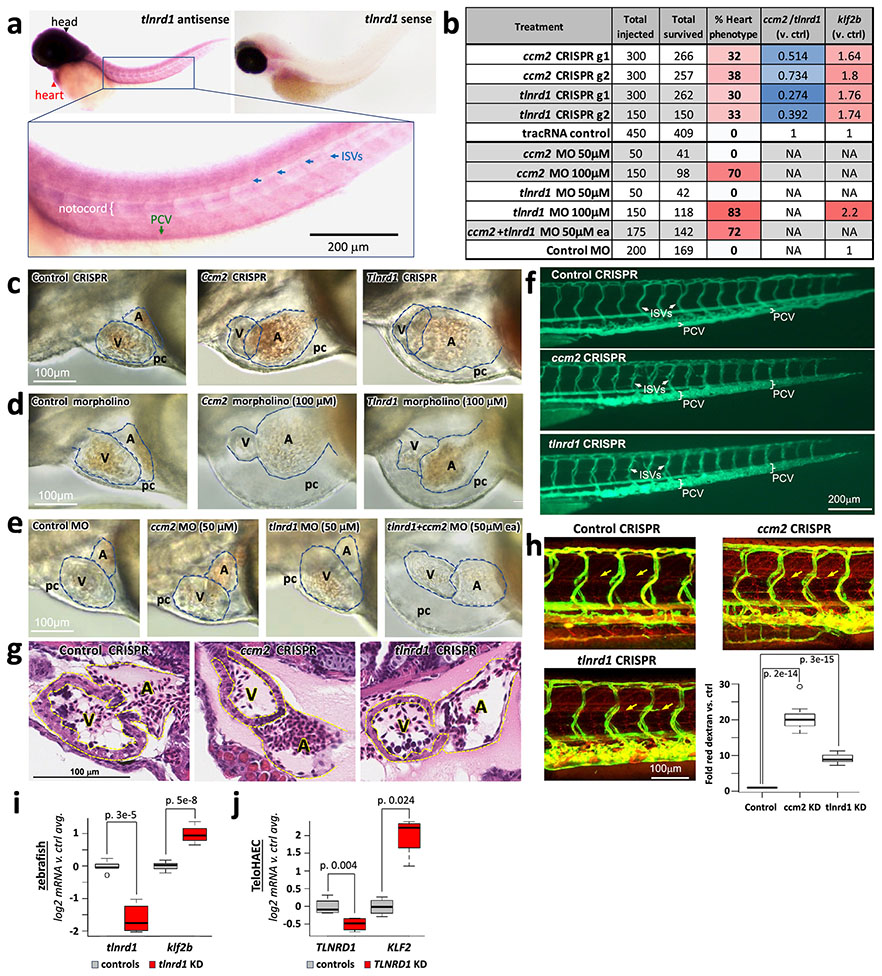
Extended Data Fig. 11. Additional analysis of ccm2 and tlnrd1 CRISPR and morpholino knockdown zebrafish embryos.
Zebrafish is a model system which has been extensively used to study CCM gene functions, and where ccm2 has been shown to have characteristic effects in heart and vascular development34,35,44,45,78,152.
(a) In-situ analysis of tlnrd1 mRNA expression. tlnrd1 mRNA, detected by the anti-sense in situ probe, is expressed in the head (black arrowhead) and heart (red arrowhead, top left), and in the notochord (white bracket), posterior cardinal vein (PCV, green arrow) and intersegmental vessels (ISVs, blue arrows, bottom panel). This staining pattern is not seen with the negative control sense probe (top right). N=10 from one experiment. This staining pattern is consistent with TLNRD1 being most highly expressed in human endothelial cells (Tabula Sapiens atlas of gene expression, https://tabula-sapiens-portal.ds.czbiohub.org/).
(b) Quantitation of ccm2 & tlnrd1 CRISPR/morpholino heart phenotypes, knockdown efficacy & effects on klf2b expression. The table summarizes the number of embryos injected with each guide, or with tracRNA control (for CRISPR experiments), or with each experimental or control morpholinos at the indicated concentration(s), the number that survived, and the percent that showed a heart phenotype characterized by enlarged atrium, pericardial edema and slow blood flow in tail veins. “ccm2/tlnrd1 (v. ctrl)” summarizes qRT-PCR analysis of knockdown efficacy (ccm2 or tlnrd1 levels in embryos with CRISPR guides to each of these target genes, versus control embryos). “klf2b (v. ctrl)” summarizes qRT-PCR quantification of klf2b in CRISPR or morpholino knockdown animals versus controls. “NA”: Effects on ccm2 or tlnrd1 were not measured for the morpholino studies, because morpholinos generally function by inhibiting translation; and klf2b levels were not tested for the indicated morpholino treatments. See also Supplementary Table 20.
(c) Light microscopic images of CRISPR embryos. Representative images of Zebrafish 3dpf embryos injected with control, ccm2 or tlnrd1 gRNA and Cas9 protein. A: atrium. V: ventricle. pc: pericardial space. For N and experimental replicates see panel (b) and Supplementary Table 20.
(d) Similar heart phenotypes in ccm2 & tlnrd1 morpholino embryos. Knockdown of either tlnrd1 or ccm2 with 100 μM anti-tlnrd1 or anti-ccm2 morpholino caused similar heart defects as seen by CRISPR knockdown, with no heart defects seen using 100 μM control morpholino. For N and experimental replicates see panel (b) and Supplementary Table 20.
(e) Synergistic effect of ccm2 & tlnrd1 morpholinos. As in (d), but showing the synergistic phenotype of 50 μM tlnrd1 & 50 μM ccm2 morpholinos, which, individually, showed no phenotype, but together showed the heart phenotype in 72% of embryos. For N and experimental replicates see panel (b) and Supplementary Table 20.
(f) Vascular phenotype in ccm2 & tlnrd1 morpholino embryos. Representative microangiogram images showing FITC dextran green (2000 kDa) injected in the vasculature in control, ccm2 and tlnrd1 gRNA injected 3 dpf larvae. Brackets mark the thickness of the posterior cardinal vein (PCV). Arrows indicate the intersegmental vessels (ISVs). Experiments were repeated 3 times. N=6 for control, and 5 for ccm2 or tlnrd1 gRNAs, from one experiment.
(g) Ventricle wall thinning in ccm2 & tlnrd1 morpholino embryos. Hematoxylin & eosin (H&E) stained sections of 3dpf embryos. A: atrium. V: ventricle. The space between dotted lines in the ventricle indicates ventricular wall thinning in ccm2 or tlnrd1 CRISPR embryos. Cells within each chamber are blood cells. N=3 for each treatment, from one experiment.
(h) More permeable vasculature in ccm2 & tlnrd1 morpholino embryos. Representative images from vascular permeability analysis in control, ccm2 and tlnrd1 gRNA injected zebrafish at 3 dpf. Red color indicates texas red dextran 70 KD, which was injected into the vasculature before imaging. Green: Green fluorescence protein expression in the vasculature (Tg:Fli GFP). Both ccm2 and tlnrd1 gRNA injected embryos displayed higher levels of red dye in the interspace between the vessels (arrows). Bottom right: Quantitation of permeability (ratio of red dextran in interspace vs. controls. n=10 for control, 13 for ccm2 & 13 for tlnrd1). Significance was assessed by two-sided T-test. Boxplot center line, median; box limits, upper and lower quartiles; whiskers, 1.5x interquartile range; points, outliers. For the complete data, see Supplementary Table 31.
(i) tlnrd1 knockdown upregulates klf2b in zebrafish. qRT-PCR for knockdown of tlnrd1 & induction of klf2b in zebrafish embryos treated with CRISPR guides to tlnrd1, or with control tracrRNA. Signal was normalized to Actin, and then to the average for controls. n=9 for klf2b (6 for guide AF, 3 for guide AN.2). n=5 for tlnrd1 (2 for guide AF, 3 for guide AN.2). Quantitation and boxplot features in in (h). For the complete data, see Supplementary Table 30.
(j) TLNRD1 knockdown upregulates KLF2 in TeloHAEC. qRT-PCR for knockdown of TLNRD1 & induction of KLF2 in TeloHAEC with Cas9-guide nucleofection knock down of TLNRD1 (or non-targeting guides, “Control”). Signal was normalized to GAPDH, and then to the average for controls. n=4 separate samples. Quantitation and boxplot features as in (h). For the complete data, see Supplementary Table 30.

