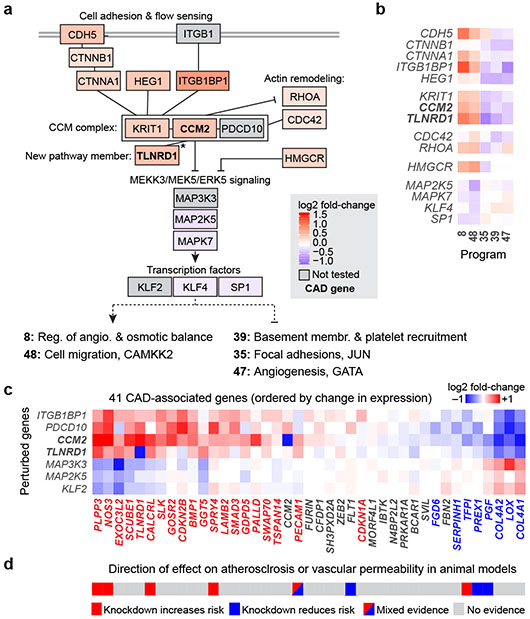
Fig. 3. Regulatory connections among CAD genes in the CCM pathway.
a. Genes that are members of the CCM complex and pathways regulate V2G2P programs for CAD. Color scale: average log2 fold-change of effect of the perturbed gene on the 5 programs, with red shading indicating knockdown leads to increased expression of Programs 8 and 48 and reduced expression of Programs 35, 39, and 47. Solid black lines indicate previously known physical or functional interactions (see Methods). *: TLNRD1 is newly linked to the CCM complex via our analysis (see next section). Gray boxes indicate functionally related genes that were not tested in the Perturb-seq experiment. Bold text: V2G2P genes for CAD.
b. Effects of genes in panel (a) on the 5 V2G2P programs. Color scale: log2 fold-change on program expression.
c. Effects of perturbing CCM pathway members on expression of the 41 V2G2P genes for CAD. Color scale: log2 fold-change on gene expression in individual knockdown experiments assayed by bulk RNA-seq (average for two guides to each target). Bold row names: V2G2P genes. Colored text in columns: Genes significantly regulated by one or more CCM pathway perturbation (FDR < 0.05), red: upregulated by upstream signaling gene perturbations or downregulated by downstream gene perturbations, blue: vice versa.
d. Likely direction of effect of V2G2P genes on atherosclerosis or vascular barrier dysfunction based on prior genetic studies in mouse models (see Supplementary Table 15 for citations).

