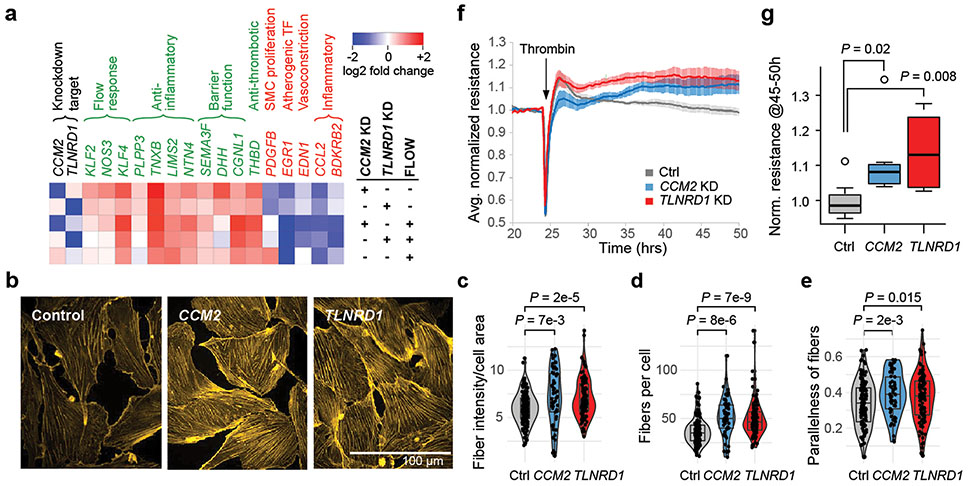
Figure 6. CCM2 and TLNRD1 knockdowns mimic the atheroprotective effects of laminar flow in ECs.
a. Heatmap of genes strongly regulated by both TLNRD1 and CCM2 that affect CAD-relevant endothelial cell functions (as per Fig. 5c), in CRISPRi TeloHAEC with the indicated treatments vs. control cells in static culture.
b. Representative maximum projection images of phalloidin-stained CRISPRi teloHAEC with control, TLNRD1 or CCM2 guides.
c. Quantitation of actin fiber (phalloidin stain) intensity per cell area (see Methods). N: Control=145, CCM2=47, TLNRD1=117. Boxplot: center line, median; box limits, upper and lower quartiles. Significance was assessed by two-sided T-test.
d. As in (c), but showing the number of actin fibers per cell.
e. As in (c), but showing parallelness of actin fibers. A score of 0 indicates randomly oriented fibers, and a score of 1 indicates all fibers in a cell are parallel to each other.
f. Trans-endothelial electrical resistance (TEER) measurements for CRISPRi teloHAEC with the indicated guides (2 guides per target), each normalized to average resistance over the 4 hours before thrombin was added to disrupt cell junctions. N=8 (control), 7 (CCM2 KD) and 6 (TLNRD1 KD). Ranges: SEM.
g. Boxplot of normalized TEER signal, from (f), averaged for hours 45 to 50 (20-25 hrs post-thrombin). Quantitation as in (c). In addition, boxplot whiskers=1.5x interquartile range and points=outliers. Note that the CCM2 KD effect we see differs from prior studies of human dermal microvascular ECs48,49, which showed decreased resistance with CCM2 perturbation. This could indicate a difference between ECs from arteries (where atherosclerosis develops) vs. capillaries.

