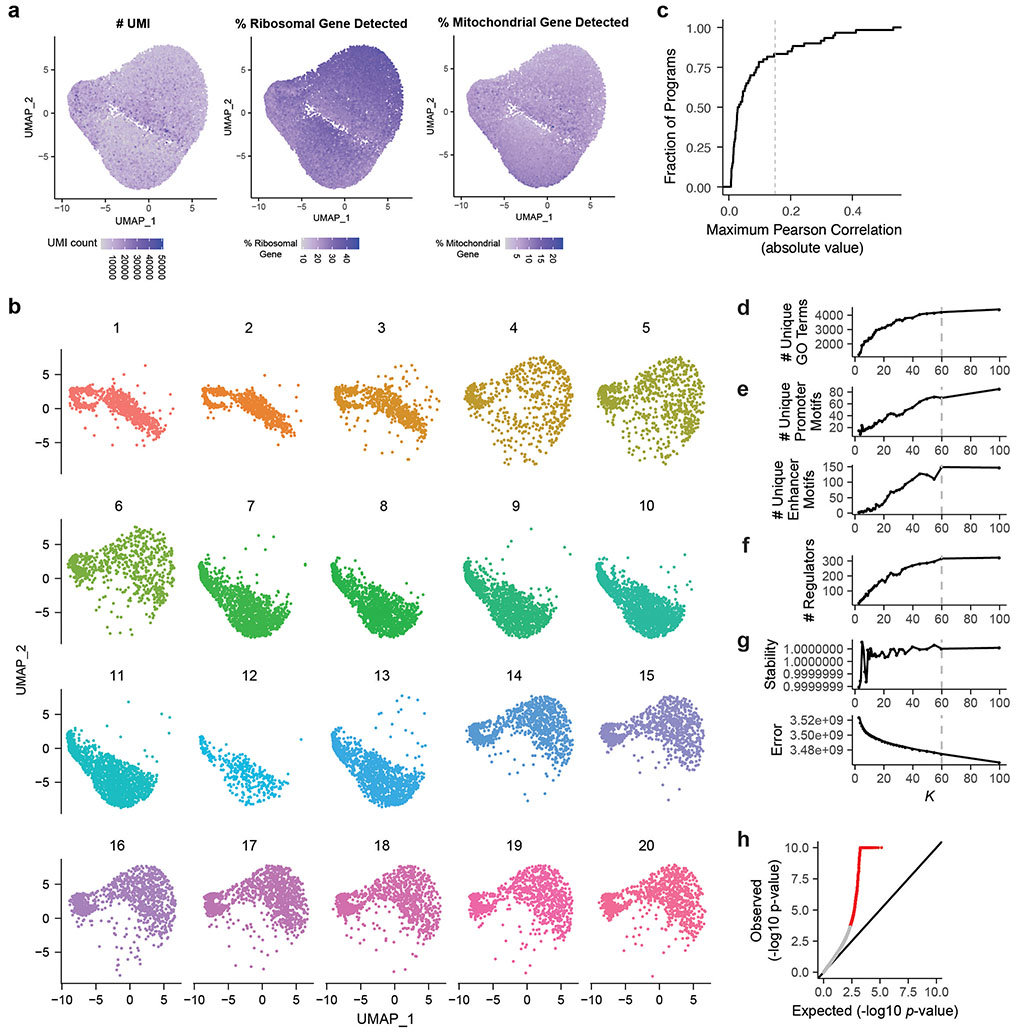
Extended Data Fig. 2. QC metrics for single cells, and selection of number of components for cNMF.
a. UMAPs showing number of UMIs per cell (left), percent ribosomal genes detected per cell (middle), percent mitochondrial genes detected per cell (right).
b. UMAPs showing cells from each of the twenty 10X lanes. The differences in clustering along the UMAP_2 axis indicates a technical batch effect between 10X lanes.
c. Cumulative distribution function (CDF) plot of the maximum absolute value of Pearson correlation between cNMF component expression in cells and batch. Dotted line: the R>=0.15 threshold used to call programs associated with batch.
d. Gene set enrichment analysis for GO terms among co-regulated genes, as a function of the number of components in the cNMF model (K). y-axis: The number of unique GO terms enriched across all programs for a given K.
e. Number of unique motifs enriched among the promoters (top) or enhancers (bottom) of co-regulated genes across all components, as a function of K.
f. Number of unique perturbations that have significant effect (FDR < 0.05) on one or more programs, as a function of K.
g. Model-based evaluation of the choice of K. Stability of the components over 100 NMF runs (top) and element-wise square of error (bottom, see Methods).
h. Quantile-quantile plot for effects of perturbations on program expression. X-axis: Expected uniform distribution. Y-axis: −log10 p-value computed from MAST package39. Red: p-value < 0.05.

