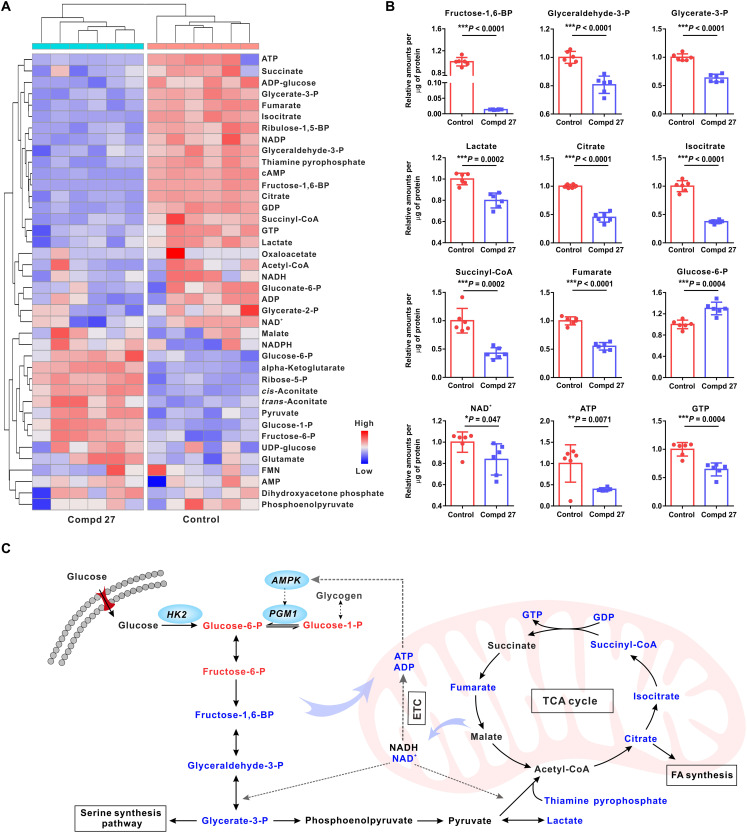
Fig. 3. Regulation of the reprogrammed metabolomic pathways of glioma U87 cells with the treatment of Compd 27.
(A) Relative difference heatmap of the clustered metabolites in U87 cells treated with/without Compd 27 (the blank control). The number of biological repeats n = 6. (B) Quantitative analysis of the metabolomic changes of U87 cells in the glycolysis and TCA cycle, with/without the treatment of Compd 27. Color codes: red (Compd 27); blue (PBS control). Statistical significance was calculated using the unpaired two-tailed Student’s t test. *P < 0.05; **P < 0.01; ***P < 0.001. (C) Visualization of differential glycolytic metabolites upon Compd 27 inhibition. Color codes: red (increased metabolites); blue (decreased metabolites).

