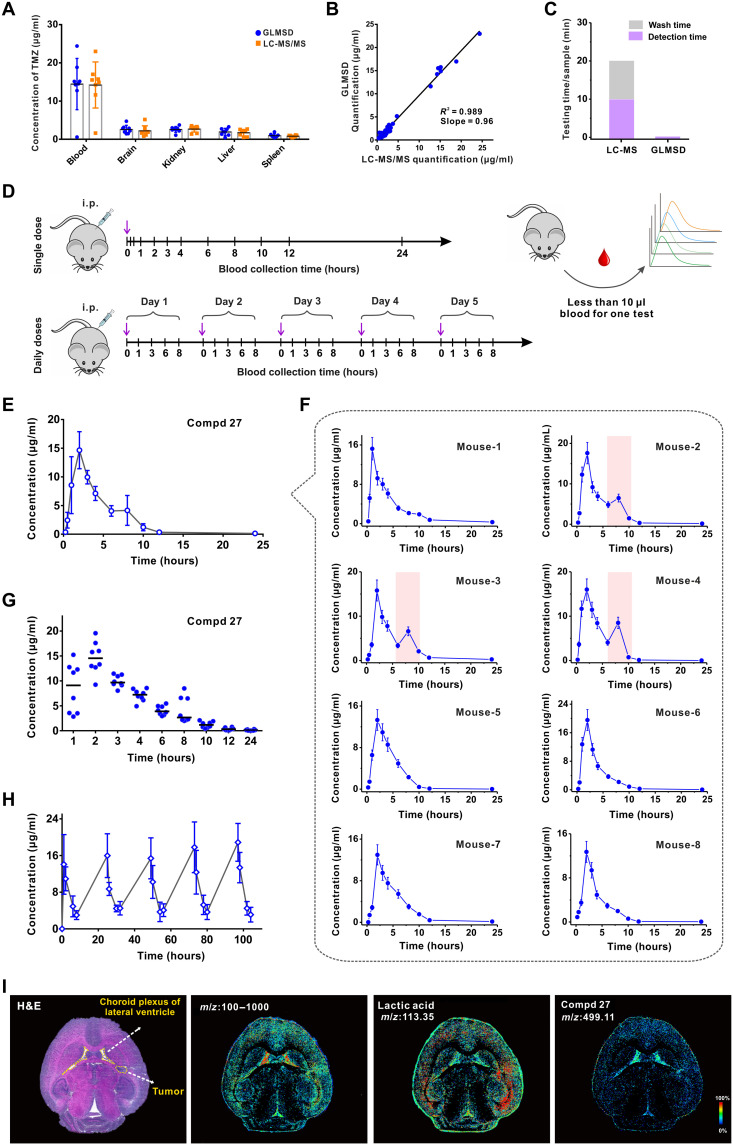
Fig. 4. Pharmacokinetic studies of the small molecular compounds by GLMSD.
(A) Quantification of TMZ in the plasma and different mouse organs by GLMSD or by traditional LC-MS/MS. The biological samples were obtained from eight mice at 3 hours after abdominal administration of TMZ with a dosage of 40 mg/kg. (B) Correlation assessment between GLMSD and LC-MS/MS in the tests of TMZ concentrations for varieties of biological samples from mice. (C) Comparison of the standard processing time between GLMSD and LC-MS/MS for each sample. (D) Schematic diagram of the drug administration in vivo and acquisition of the blood samples during the experimental time course. i.p., intraperitoneally. (E) The averaged profiles of Compd 27 concentrations in plasma verse time after intraperitoneal administration with a dosage of 40 mg/kg. Error bar, SD (mouse replicates n = 8). (F) The pharmacokinetic profiles of Compd 27 in each mouse. Eight mice were tested in parallel. Reabsorption of the drug was highlighted by the pink shades. (G) The pharmacokinetic profiles of Compd 27 by GLMSD, after the last dose of TMZ (intraperitoneally) for 5 days successively. Each dosage: 40 mg/kg. Mouse replicates n = 8. (H) The averaged pharmacokinetic profiles of Compd 27 by GLMSD in mice (n = 8) in the successively multiple-dose treatment (intraperitoneally). Each dosage: 40 mg/kg. (I) Mass spectral imaging of Compd 27 (m/z 499.11) and the other metabolites (e.g., lactic acid, m/z = 113.35) in the brain tissue slice, with an optical micrograph of an H&E-stained consecutive slice as a reference. Yellow dashed rings, the tumor site in an orthotopic mouse brain tumor model or lateral ventricle in the brain section. Signal intensities encoded with a color bar. Image resolution, 10 μm.

