
Figure 5.
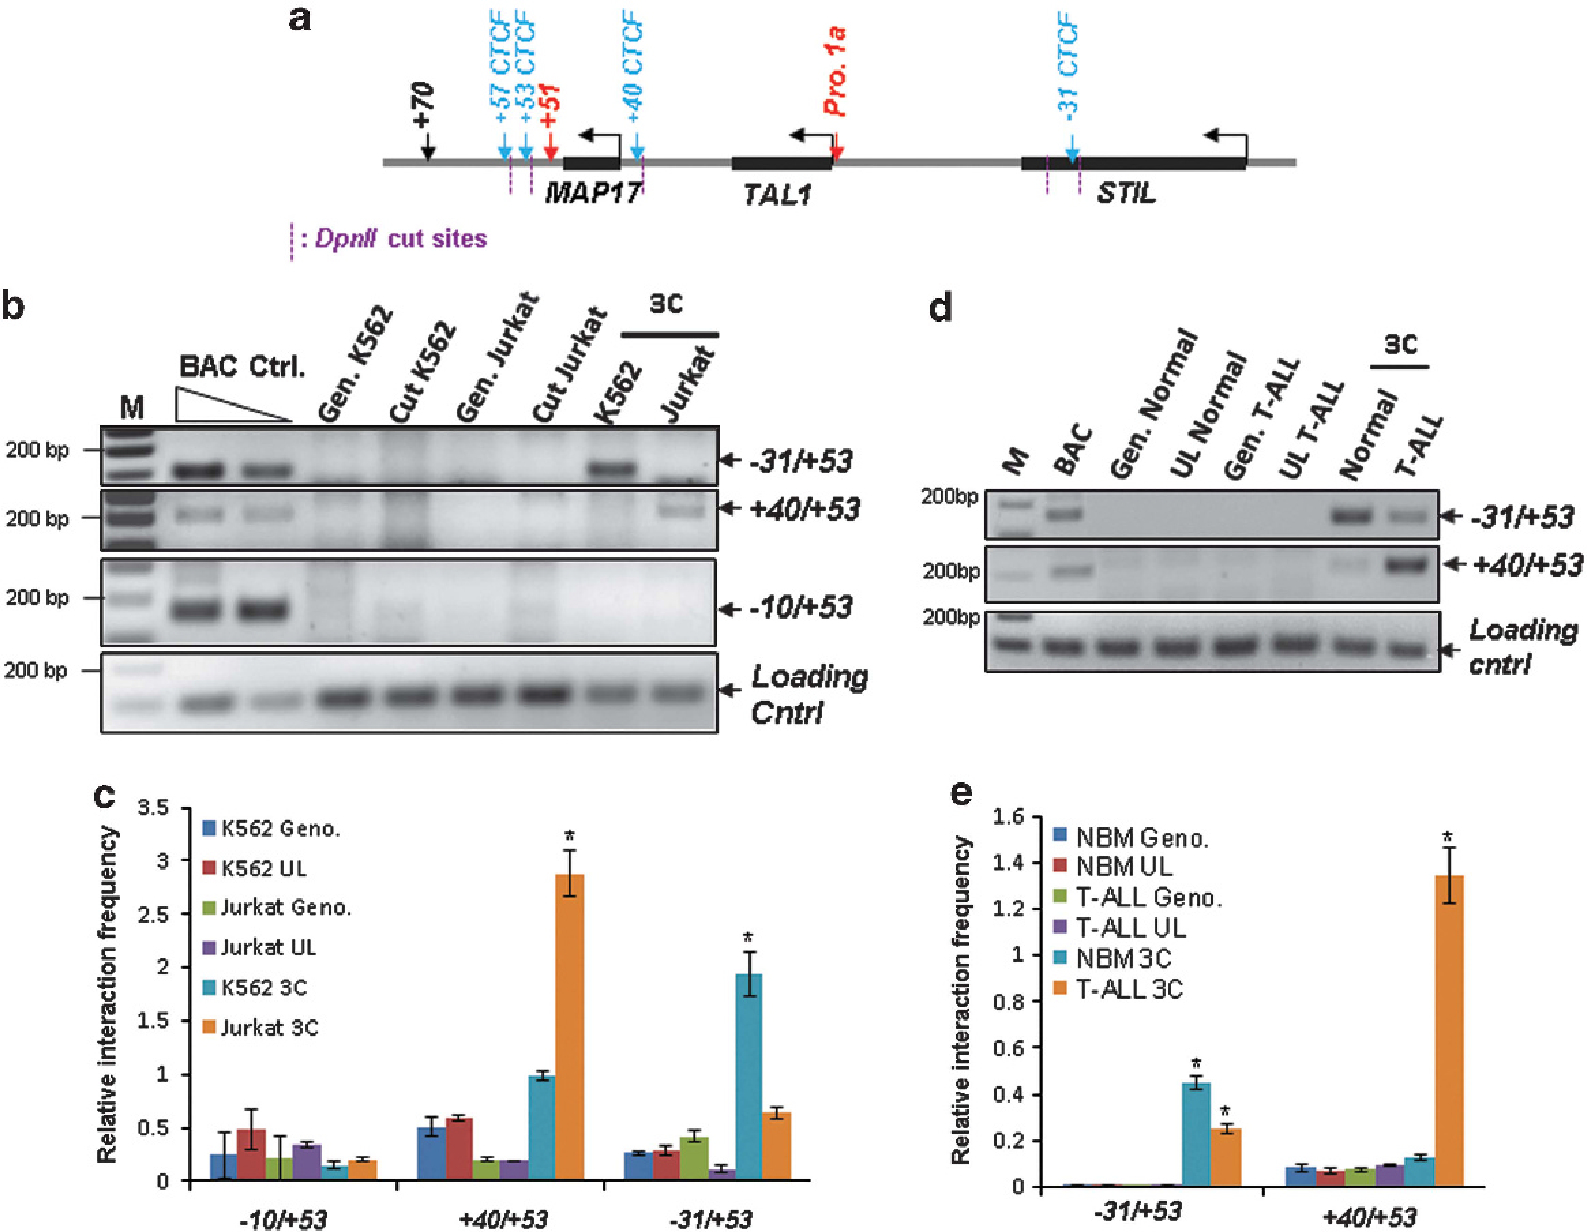
CTCF-mediated genome organization regulates enhancer and promoter interaction in the TAL1 locus. (a) Schematic representation of the TAL1 locus and CTCF sites is indicated by blue arrows. The predicted DpnII restriction fragments are indicated by magenta dashed lines. (b) The 3C analysis of long-range genome interaction among CTCF sites in the TAL1 locus comparing K562 and Jurkat cells. (c) A total of three independent 3C experiments were quantitated by densitometry. Data are shown as mean ± s.d. of three independent experiments. *P < 0.05. (d) The 3C analysis of long-range genome interaction among CTCF sites in the TAL1 locus comparing normal BM and T-ALL patient BM cells without chromosomal rearrangement detected in the TAL1 locus. (e) A total of three independent 3C experiments were quantitated by densitometry. Data are shown as mean ± s.d. of three independent experiments. *P < 0.05.