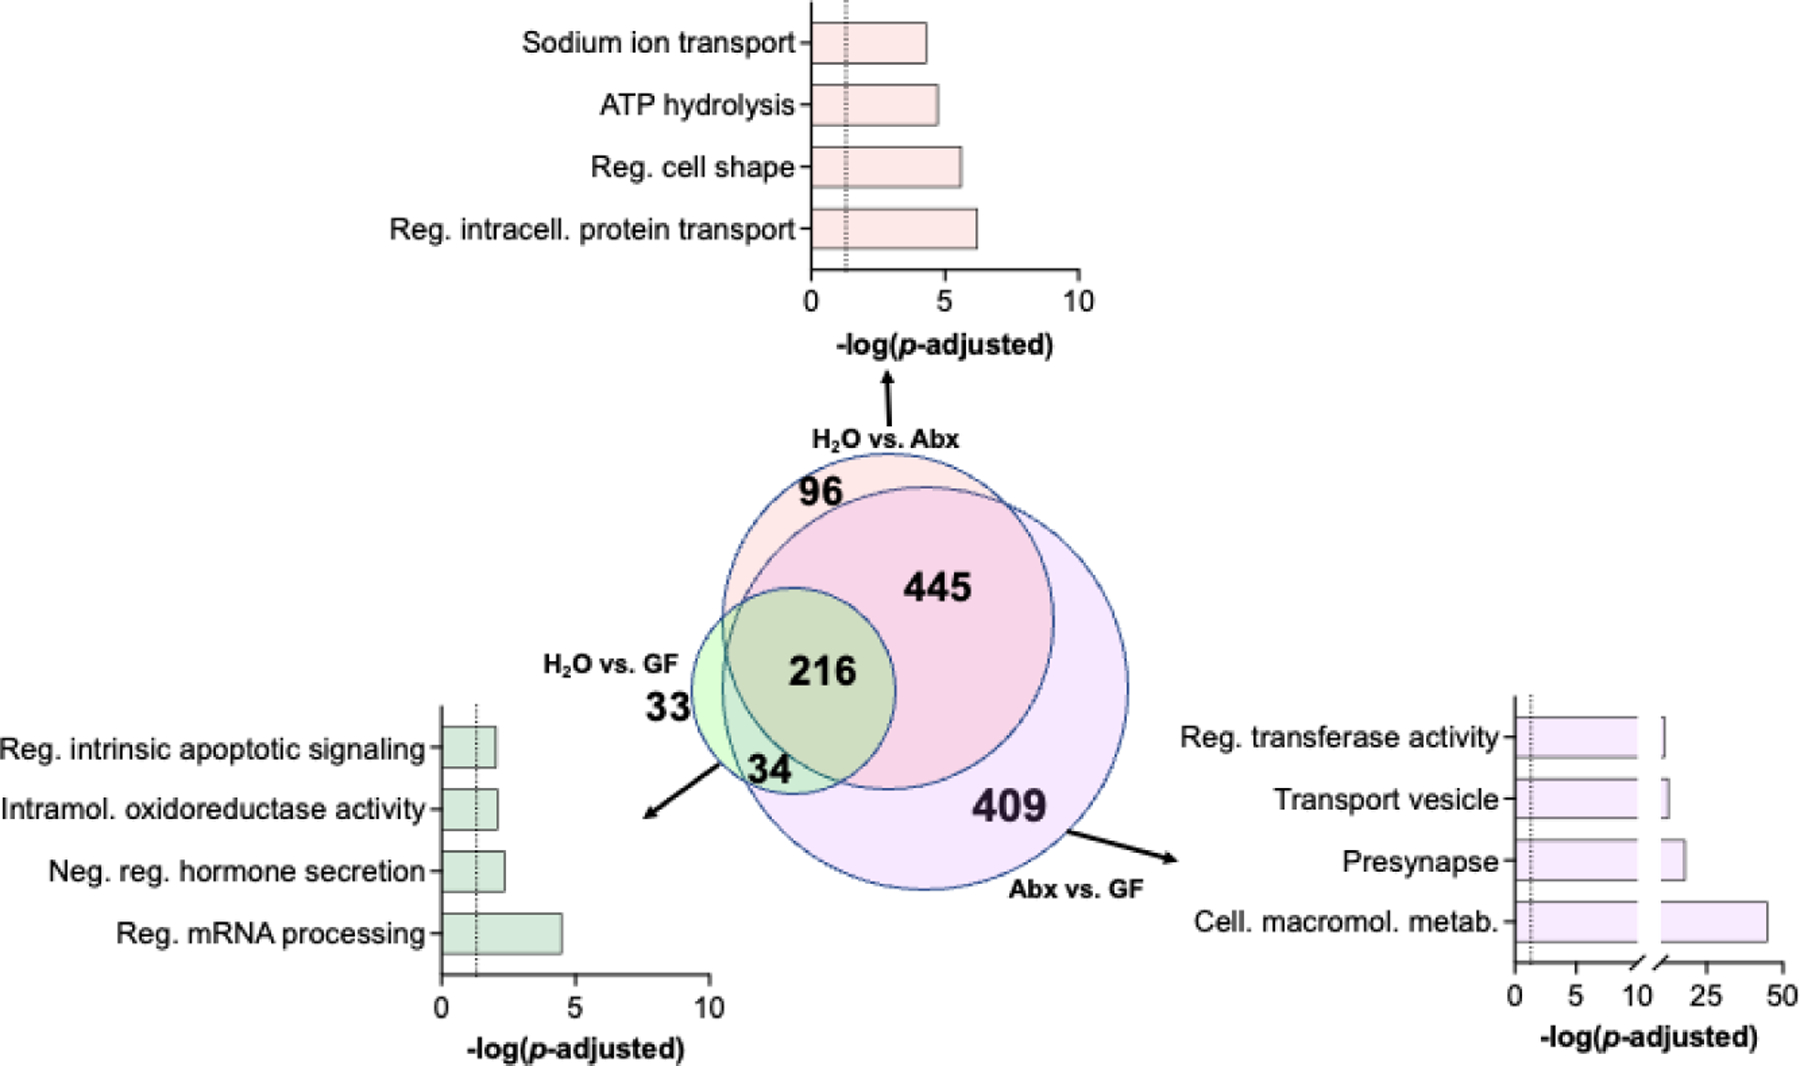
Figure 3 – Overlap of gene ontology pathways between morphine groups.

Venn diagram showing overlap of significant gene ontologies between all pairwise comparisons in morphine groups (center). Top significant pathways from H2O vs GF (left), H2O vs Abx (top), and Abx vs GF (right) groups are highlighted.
