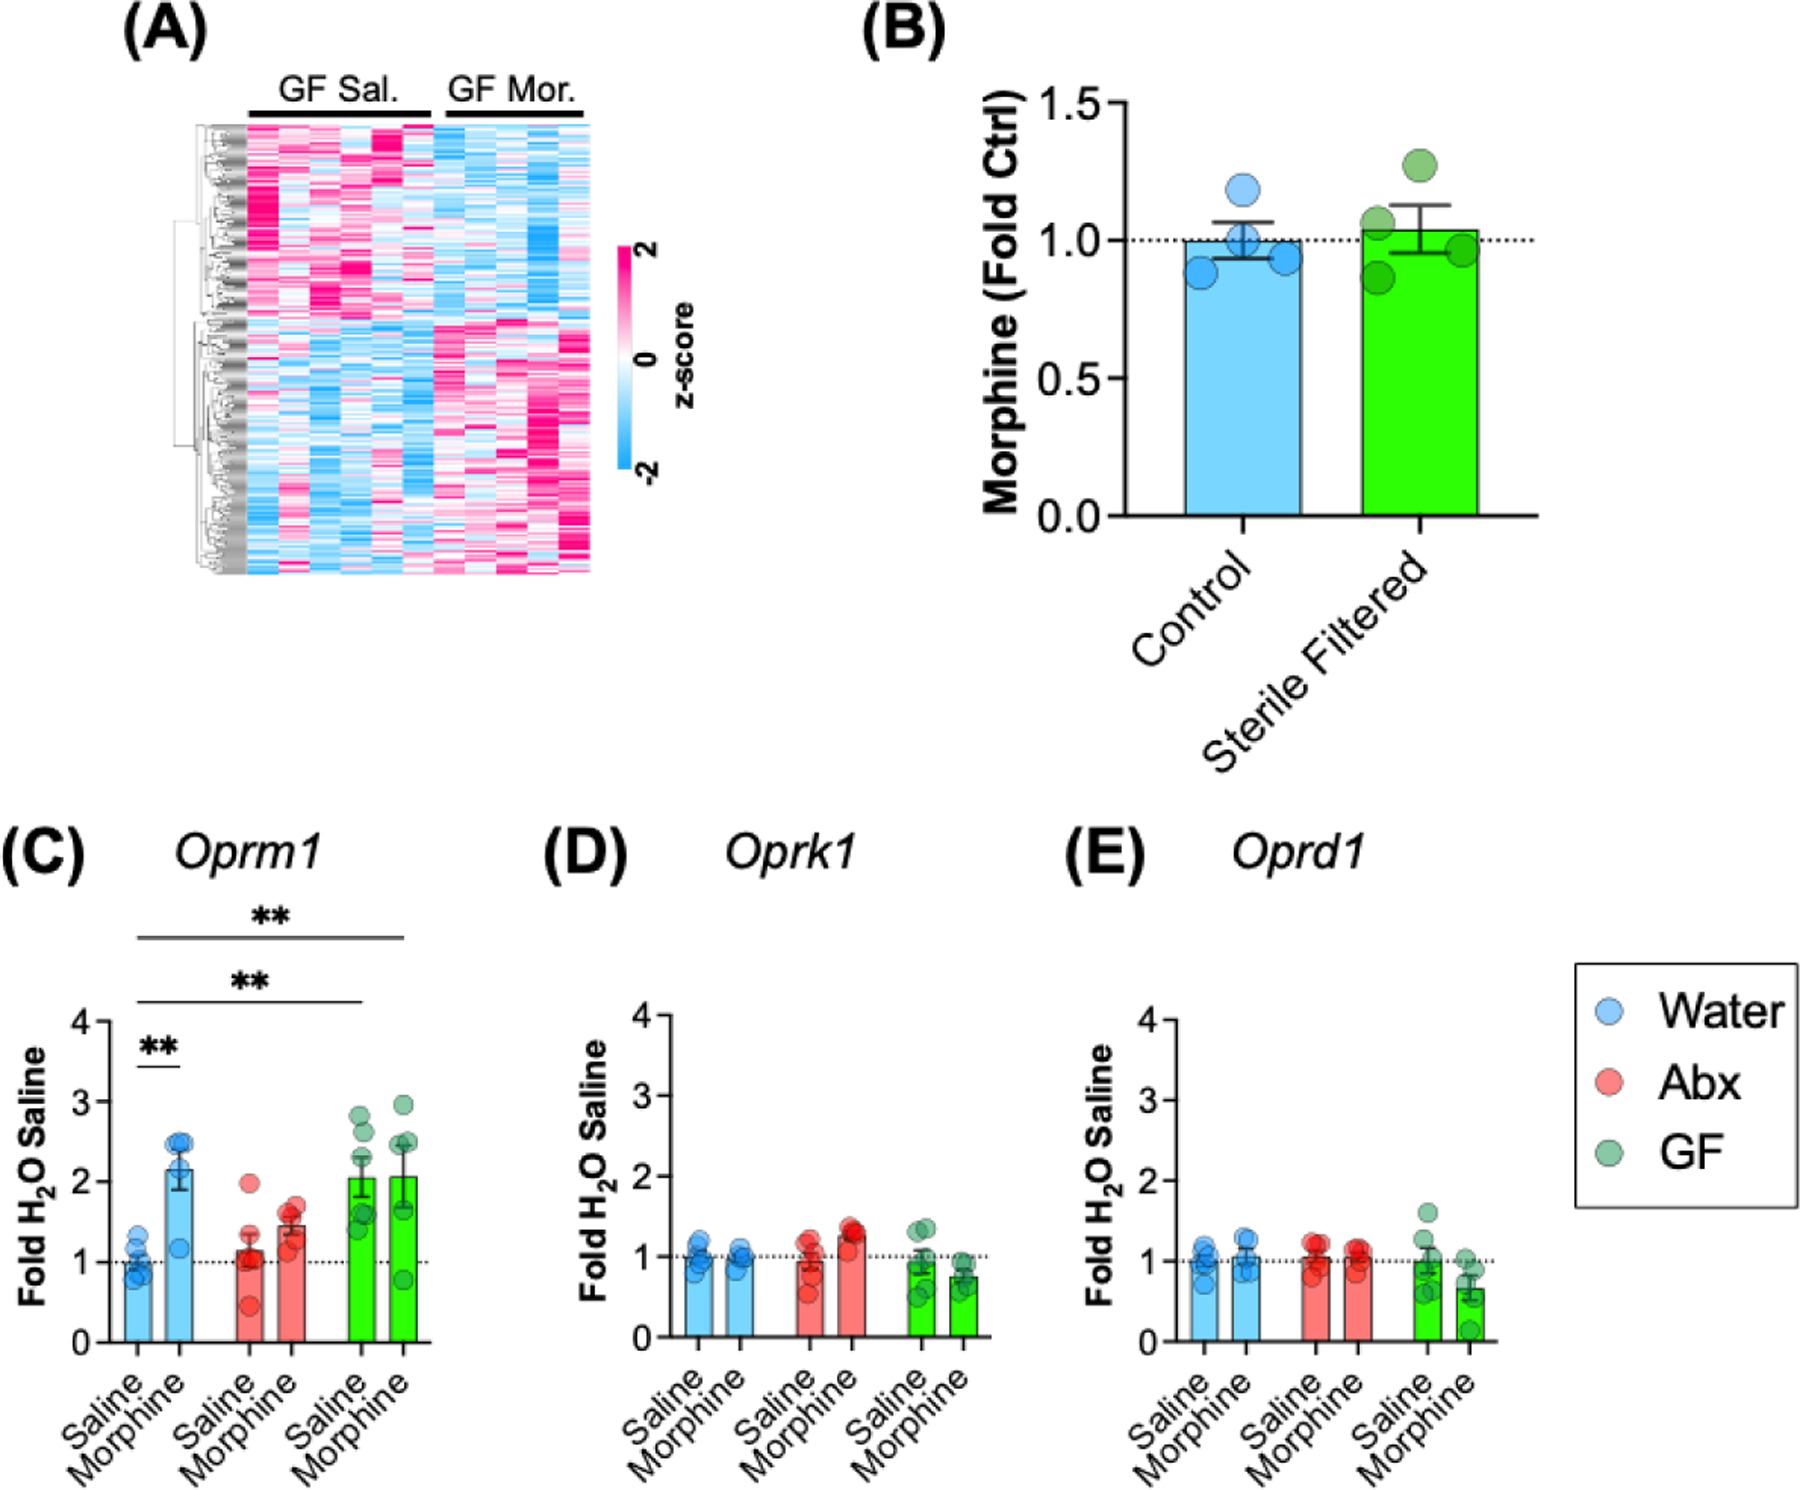
Figure 4 – Effects of morphine treatment in germ-free mice.

(A) Heatmap of relative expression of all genes with nominal p value < 0.05 between GF-Sal and GF-Mor groups. Scale is of z-scored FPKM values. (B) Concentration of morphine solutions used to inject conventionally raised mice (Control) and germ-free mice (Sterile filtered). (C-E) Between group comparisons of mu (Oprm1), kappa (Oprk1), and delta (Oprd1) receptor transcript levels for all groups. All data are presented as mean ± S.E.M.; ** p < 0.01 on Holm-Sidak post-hoc test.
