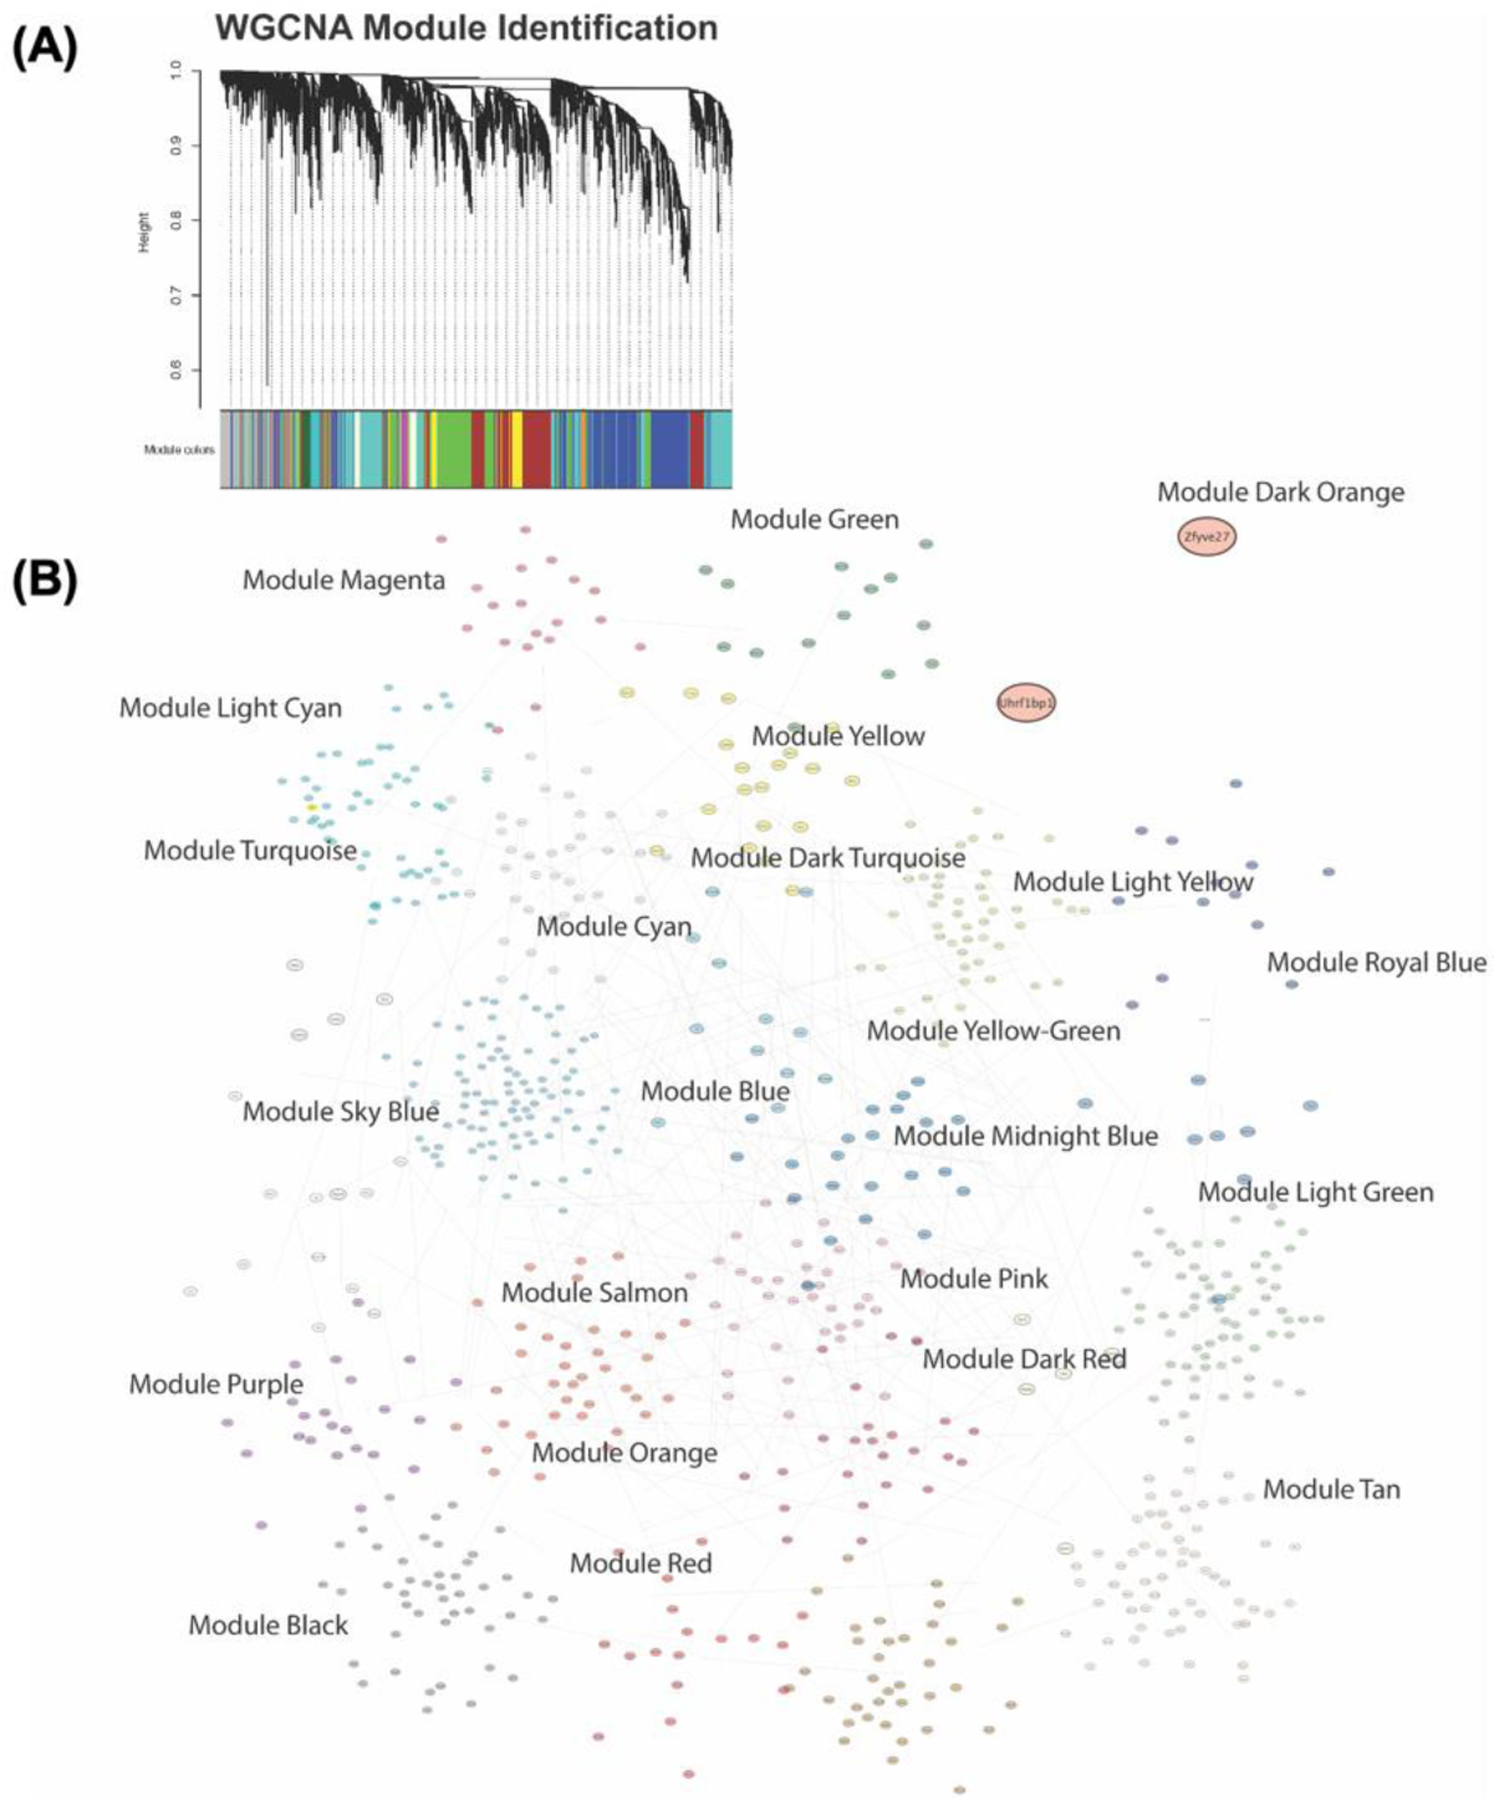
Figure 5 – WGCNA module identification.

To identify modules of coexpressed genes in our sample groups WGCNA hierarchical clustering analyses were performed followed by branch cutting based on variance to separate samples into coexpressed modules. (A) Clustering dendrogram with the height represented as 1 – r for the correlation and the colored rows along the bottom representing the assigned modules. (B) Graphical representation of gene modules as topological network diagram of all modules and their contained genes and interactions.
