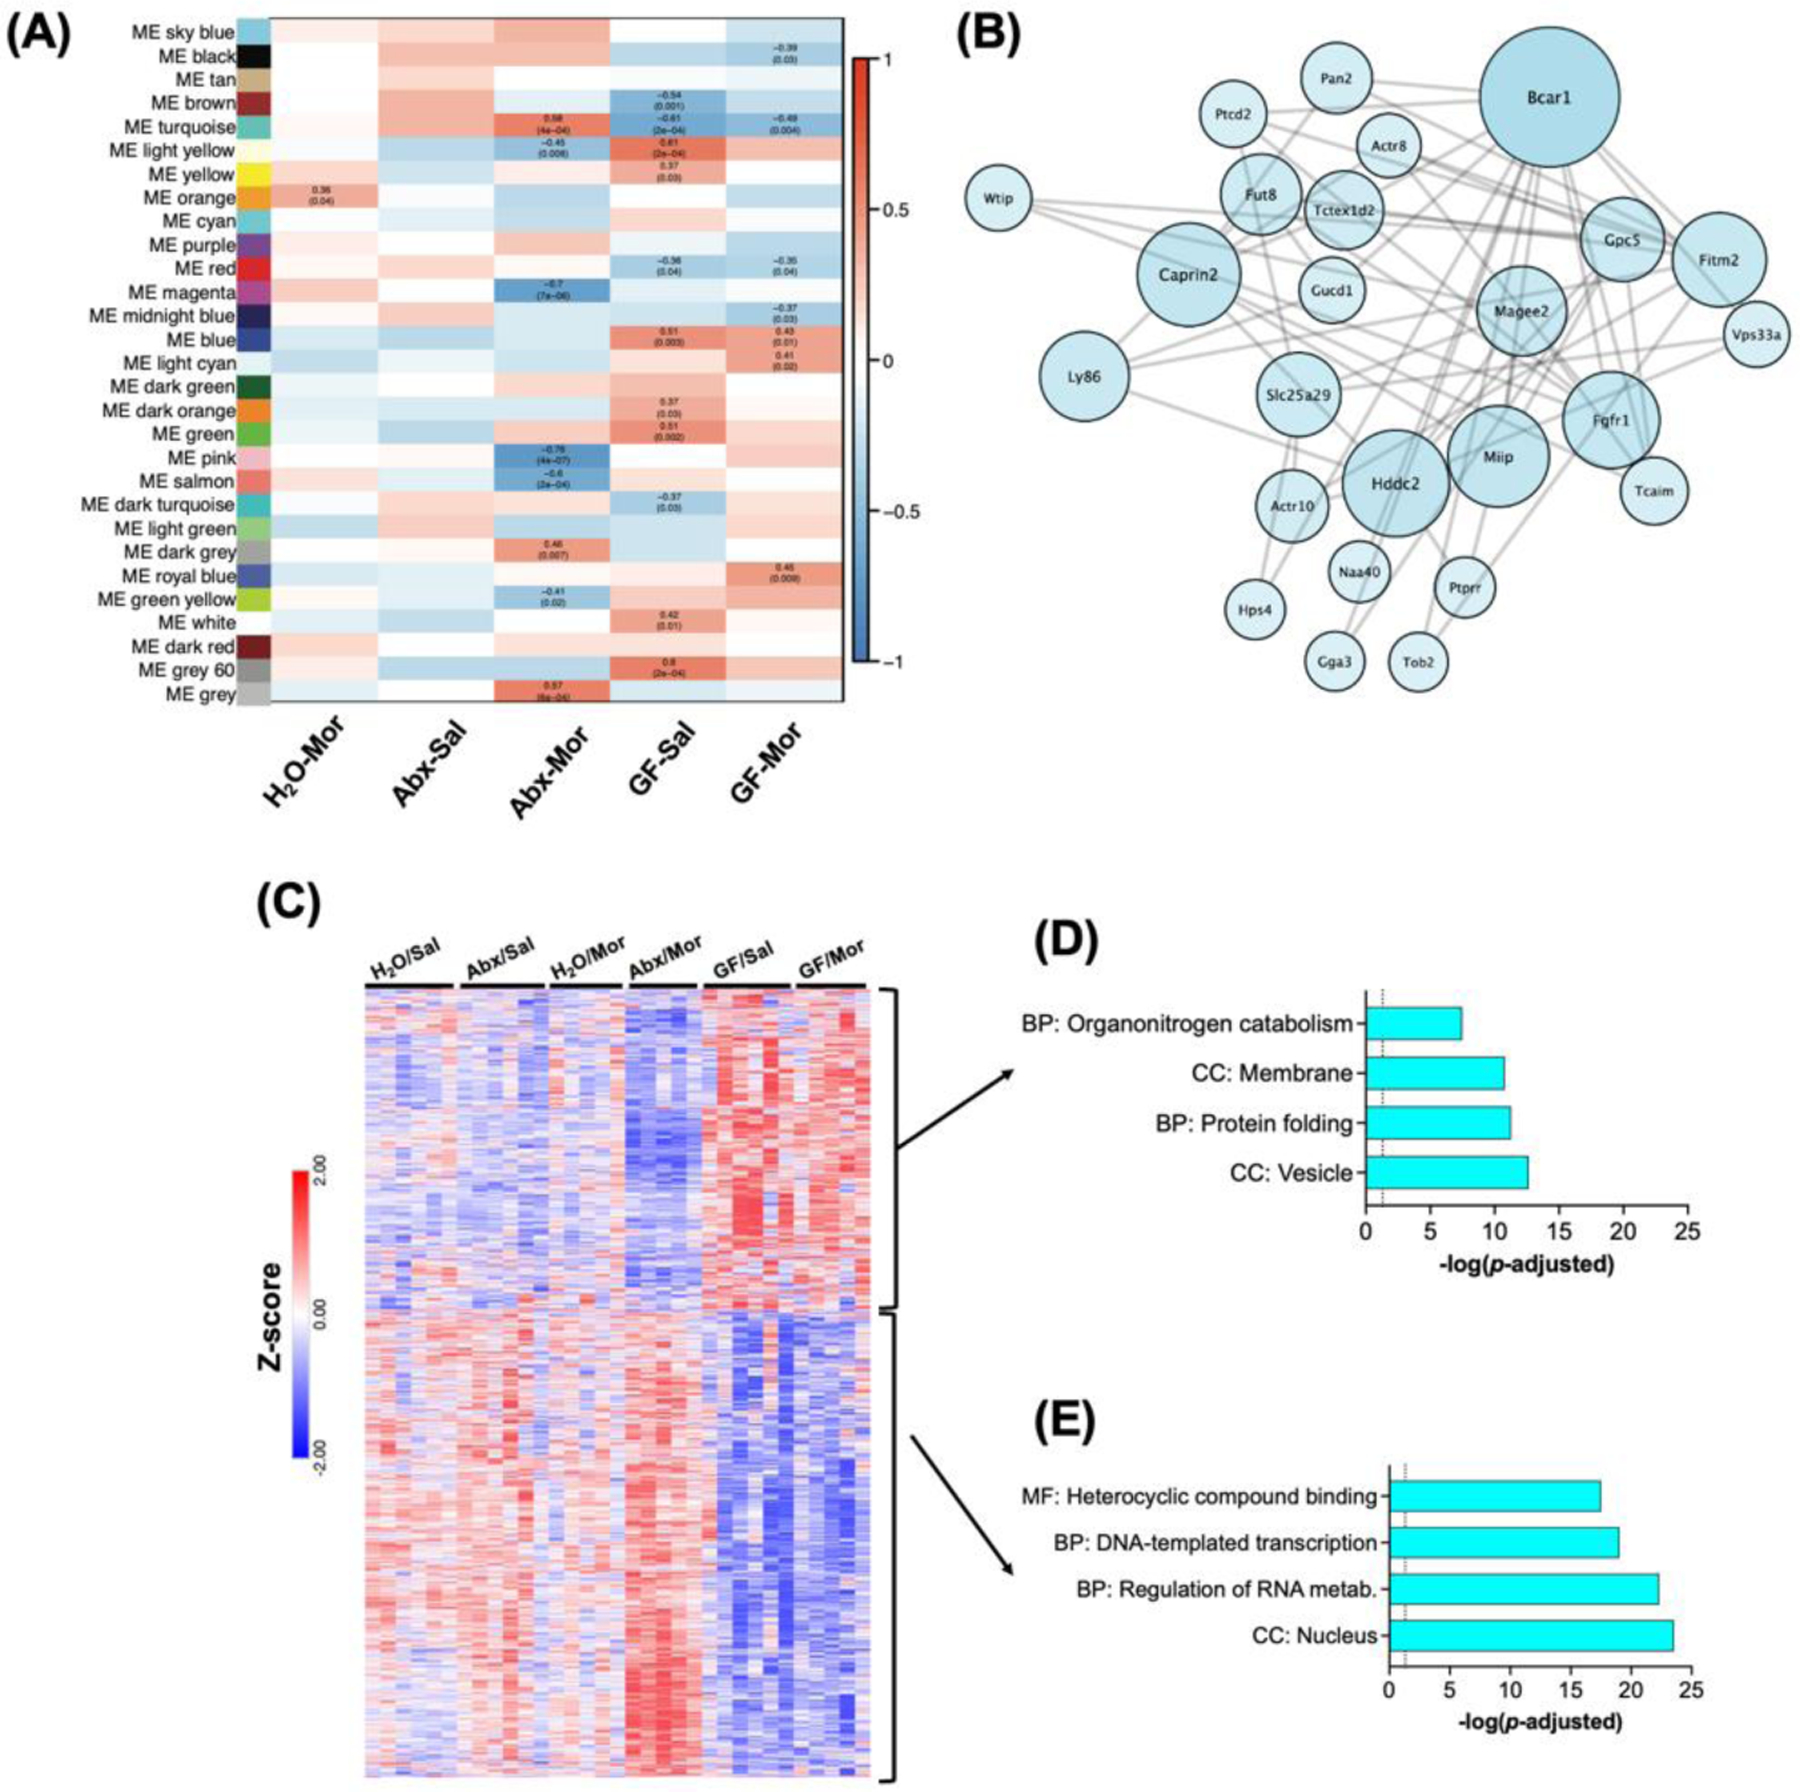
Figure 6 – Initial WGCNA analysis.

(A) Correlation matrix of module eigengene relationship with individual treatment groups. Significant cells are labeled with r value and p value. (B) Topological network diagram of the top 25 weighted genes in theTurquoise module, which is the largest gene module and the only one with significant effects in Abx-Mor and GF mice. (C) Heatmap of z-scored FPKM expression data for all genes in turquoise module followed by unsupervised hierarchical clustering. (D) Select significant gene ontologies from subset of Turquoise module genes decreased in Abx-Mor and increased in GF groups. (E) Select GO pathways for subset of Turquoise genes decreased in GF and increased in Abx-Mor.
