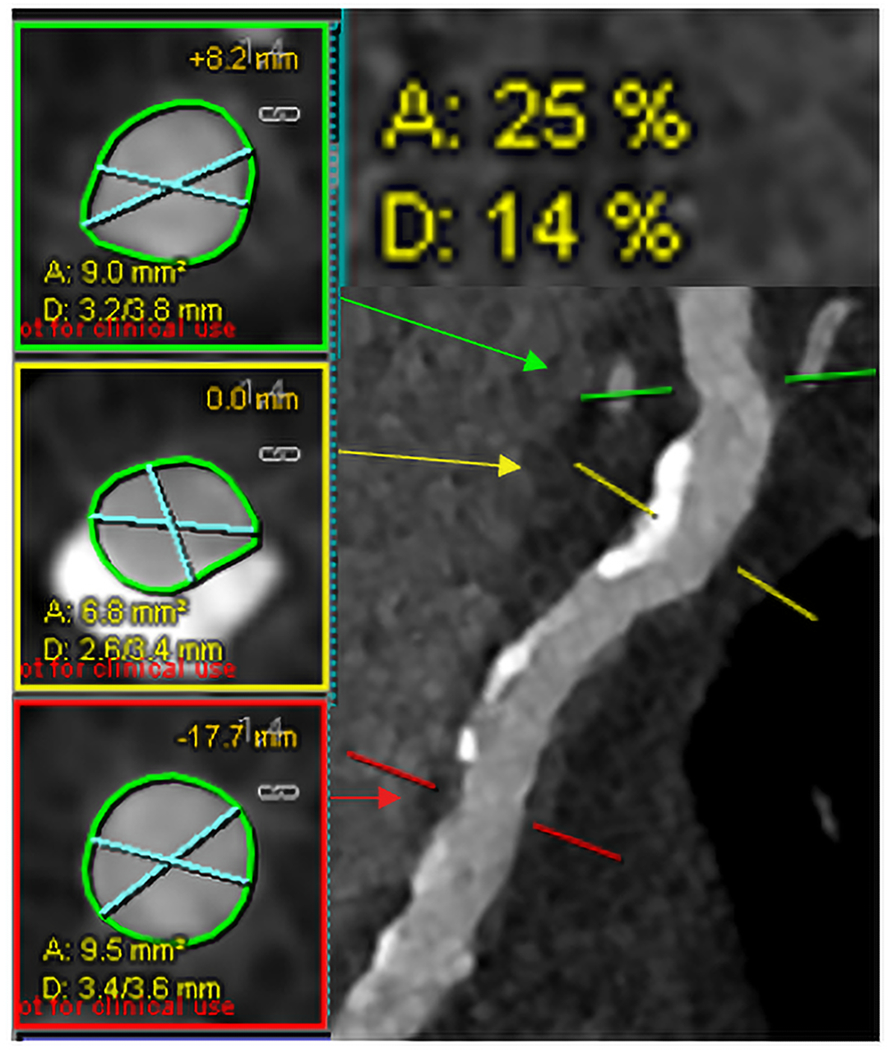
Figure 1.

Example of stenosis quantification for the proximal left anterior descending coronary artery of a representative PCD-CT case using commercial software (Syngo.via). Markers were placed at the highest stenosis (yellow, middle) and upper (green, top) and lower reference (red, bottom) locations. Respective cross-sections (left panel) with blue lines representing smallest and largest diameter were shown with percent area and diameter stenosis (upper right). (PCD=photon-counting-detector).
