

Abstract
13C-Metabolic Flux Analysis (13C-MFA) and Flux Balance Analysis (FBA) are widely used to investigate the operation of biochemical networks in both biological and biotechnological research. Both methods use metabolic reaction network models of metabolism operating at steady state so that reaction rates (fluxes) and the levels of metabolic intermediates are constrained to be invariant. They provide estimated (MFA) or predicted (FBA) values of the fluxes through the network in vivo, which cannot be measured directly. These fluxes can shed light on basic biology and have been successfully used to inform metabolic engineering strategies. Several approaches have been taken to test the reliability of estimates and predictions from constraint-based methods and to compare alternative model architectures. Despite advances in other areas of the statistical evaluation of metabolic models, such as the quantification of flux estimate uncertainty, validation and model selection methods have been underappreciated and underexplored. We review the history and state-of-the-art in constraint-based metabolic model validation and model selection. Applications and limitations of the χ2-test of goodness-of-fit, the most widely used quantitative validation and selection approach in 13C-MFA, are discussed, and complementary and alternative forms of validation and selection are proposed. A combined model validation and selection framework for 13C-MFA incorporating metabolite pool size information that leverages new developments in the field is presented and advocated for. Finally, we discuss how adopting robust validation and selection procedures can enhance confidence in constraint-based modeling as a whole and ultimately facilitate more widespread use of FBA in biotechnology.
Keywords: Metabolic modeling, Constraint-based modeling, model validation, model selection, Flux Balance Analysis, Metabolic Flux Analysis
Graphical Abstract

Validation and model selection practices in constraint-based metabolic modeling are reviewed and critically evaluated. Recommendations are made on best practice, with a particular focus on the validation of internal flux predictions in Flux Balance Analysis and the limitations of the chi-squared test of goodness-of-fit in Metabolic Flux Analysis.
Introduction
The set of biochemical reaction rates in the metabolic network of a living system (its flux map) represents an integrated functional phenotype that emerges from multiple layers of biological organization and regulation, including the genome, transcriptome, and proteome (1). The study of metabolic fluxes is therefore important for systems biology, rational metabolic engineering, and synthetic biology. A grand challenge of systems biology is building an integrated mechanistic understanding of the operation of living organisms across these levels of regulation (2) – an understanding that goes beyond statistical or correlative descriptions, however useful these can be. Meeting this challenge requires fluxes to be accurately predicted from network structure using explicit rules or hypotheses and reliably estimated using experimental data. Fluxes are also critical to many biotechnological and metabolic engineering applications. Examples such as the development of lysine hyper-producing strains of Corynebacterium glutamicum (3–5) and the rewiring of E. coli’s metabolism to make it grow chemoautotrophically (6) attest to the usefulness of these techniques. As the scale and complexity of integrative systems biology and biological engineering efforts increase, so too will the need for reliable and robust estimates of fluxes.
In vivo fluxes cannot be directly measured, necessitating modeling approaches to estimate or predict them. The most commonly used approaches for metabolic modeling are the constraint-based modeling frameworks of 13C-Metabolic Flux Analysis (13C-MFA) and Flux Balance Analysis (FBA). Both require a metabolic network consisting of metabolites linked by biochemical reactions to be defined using the biochemical literature, knowledge of the enzymes and transporters expressed from the genome, and physico-chemical rules. In 13C-MFA, atom mappings describing the positions and interconversions of the carbon atoms in reactants and products are also included in the model. These methods assume that the system is at metabolic steady-state, such that the concentrations of all metabolic intermediates and reaction rates are constant (7). External fluxes, such as the uptake of a substrate or the rate of production of new cells or a product, are also measured and used to constrain the possible flux ranges. These assumptions and constraints define a “solution space” containing all flux maps consistent with them but are typically insufficient to pinpoint a unique flux map.
In 13C-MFA, isotopic labeling data is used to identify a particular solution within the solution space. 13C-labeled substrates are fed to the system under investigation and the endpoint labeling, or time-course labeling in Isotopically Nonstationary Metabolic Flux Analysis (INST-MFA), of metabolites is measured using mass spectrometry and/or NMR techniques (7,8). Given a metabolic network, a flux map, and information about the labeled substrate fed into the system, the label distribution through all the metabolites in a network can be solved analytically. However, 13C-MFA works backwards from measured label distributions to flux maps by minimizing the differences between measured and estimated Mass Isotopomer Distribution (MID) values by varying flux estimates (9). For INST MFA pool size measurements can also be included in the minimization process.
In FBA, linear optimization is used to identify a flux map (or set of flux maps) from the solution space (10). This is the map(s) for which the sum of one or more fluxes (the objective function) is maximized or minimized. Objective functions frequently represent measures of efficiency, including the maximization of growth rate or product formation or the minimization of total flux (11). Such functions may embody hypotheses about what the in vivo system has been evolutionarily tuned to optimize, or questions about the operational capacity of that system under particular conditions. Since the objective function, together with the network architecture and empirical and/or theoretical constraints introduced by the modeler, is a key determinant of the flux maps generated by FBA, careful selection, justification, and, ideally, validation of objective functions is crucial. As shown in (12), alternative objective functions can, and should, be evaluated to identify those that result in the best agreement with experimental data. In many cases, the constraints – typically on external fluxes – imposed during an FBA optimization result in a set of viable flux maps (a solution space) rather than a single map. In such cases, related techniques, including Flux Variability Analysis (13) and random sampling (14–17) can be used to characterize the set of flux maps consistent with the set constraints. The computational tractability and small amount of experimental data necessary to perform FBA allow the analysis of Genome-Scale Stoichiometric Models (GSSMs). These models incorporate all known reactions believed to occur in an organism based on a combination of genome annotation and manual curation. Additional linear-optimization-based methods for solving GSSMs using the FBA framework have been developed and are sometimes used together with FBA. These include Minimization of Metabolic Adjustment (MOMA) (18), and Regulatory On/Off Minimization (ROOM) (19), as well as a host of methods that incorporate omic data into the optimization process (e.g. (20–24)). FBA and its related methods are sometimes used to analyze models other than true GSSMs, such as “core” models that focus on central metabolic processes that conduct the large majority of flux (25). When discussing validation, however, the same principles apply to all of these linear optimization methods and across the different model scales. For the sake of simplicity, we will be using “FBA” to refer to this family of methods generally and will refer to the medium- to large-scale models used with these methods as “FBA models.”
Progress has been made in improving the statistical rigor and reliability of flux estimates and characterizing uncertainty in estimates and predictions. For example, in MFA, the development of effective methods for flux uncertainty estimation (26) allows researchers to better quantify confidence in flux predictions and, where appropriate, to gather additional data to better support their conclusions. Bayesian techniques for the characterization of uncertainties in flux estimates derived from isotopic labeling have also been presented (27). On the experimental side of MFA, there have been advances in designing and implementing parallel labeling experiments, wherein multiple tracers are employed in parallel labeling experiments and the results are simultaneously fit to generate a single 13C-MFA flux map. This enables more precise estimation of fluxes than experiments with individual tracers or tracer combinations allow (28–35). Greater resolution in isotopic labeling data through the use of tandem mass spectrometry techniques, which allow for the quantification of positional labeling, can also improve the precision of modeled fluxes, as described in (36,37). Recent years have also seen developments in FBA meant to improve the reliability of its predictions. For example studies have characterized the impact of departures from metabolic steady state and devised methods to account for uncertainties in biomass compositions (e.g. (38,39)). The many sources of uncertainty when working with FBA and genome-scale models, and attempts to characterize and mitigate this uncertainty, have been reviewed elsewhere (40).
In this review, we specifically focus on the validation of flux predictions and estimates from constraint-based modeling studies and the selection of well-supported model architectures, which have received less attention and specific treatment in the literature. How can MFA and FBA researchers validate the accuracy of their estimates and predictions? These flux analysis methods also require researchers to make choices about the network structure of the model to be used. This leads to questions of model selection; that is, how do we select the most statistically justified model from among the alternatives? Validation and model selection are key to improving the fidelity of model-derived fluxes to the real in vivo ones. The fields of systems and synthetic biology have seen substantial development of model selection and validation practices (41,42), but these topics are not frequently discussed in the metabolic modeling literature. Previous reviews and methods papers have touched on the use of tools like the χ2-test of goodness-of-fit for the validation of MFA models (43,44). However, to our knowledge, no reviews covering the various methods for validating FBA predictions exist, nor have previous reviews discussed the various limitations of the χ2-test. Moreover, previous reviews have not addressed the most recent improvements in model selection in 13C-MFA, which have not been adequately incorporated into routine practice. Addressing these topics explicitly is important for practitioners as they carry out their work. It is also important for readers of the flux analysis literature, who must understand the assumptions, tests of validity, and model selection techniques underlying what they are reading.
Although only a subset of research groups conduct both FBA and MFA modeling, we believe most metabolic modeling practitioners and consumers read literature containing both modeling paradigms. As we highlight in this review, some similar themes emerge when examining the validation of both FBA and MFA flux maps. Finally, one of the most robust validations that can be conducted for FBA predictions is comparison against MFA estimated fluxes, which makes simultaneously considering the validity of both FBA and MFA flux maps crucial. For these reasons, we consider both modeling approaches in this review.
We review and provide our perspective on these areas and prospects for future development, highlighting: (1) Validation methods applicable to FBA flux maps; (2) approaches for validating 13C-MFA flux maps; and (3) developments and prospects for model selection in 13C-MFA; (4) How validation and model selection practices in 13C-MFA could benefit from a greater emphasis on the isolation of training and validation datasets and; (5) the importance of corroborating flux mapping results using independent modeling and experimental techniques.
Validation Techniques in FBA and 13C-MFA
FBA and 13C-MFA studies commonly validate the model(s) used, though there is great variation in their nature and extent. We summarize these validation strategies in Figure 1.
Figure 1:

Graphical summary of validation strategies in (A) FBA and (B) 13C-MFA. Dotted lines connect inputs with the associated validation technique(s). (A) FBA predictions can be validated by comparing growth rate or growth/no-growth phenotypes across different substrates, growth conditions, or sets of gene knockouts in silico and in vivo. Values can be calculated from flux maps and compared with experimental measurements. FBA internal flux predictions can be compared with 13C-MFA fluxes. (B) Values can be calculated from 13C-MFA flux maps and compared with an independent experimental measurement from the in vivo system. Goodness-of-fit can be assessed between simulated and measured MIDs, and simulated and measured metabolite pool sizes in INST-MFA. Flux maps can be compared with the results of independent modeling exercises. Molecules are schematically shown as connected circles of atomic positions: open circles are unlabeled, and filled circles are isotopically labeled. Abbreviations: Mn - metabolites in the metabolic network; Sn – exogenous substrates; Vi – Fluxes; [Mn] – metabolite concentrations.
Validation in FBA
The COnstraint-Based Reconstruction and Analysis (COBRA) framework, implemented in software solutions such as the COBRA Toolbox (45) and cobrapy (46) and widely used for FBA studies, features functions and pipelines that can be used to ensure basic functionality of models including balancing of charge, pH, and cofactors/cosubstrates, thermodynamic feasibility, and connectivity of all metabolites. Model characteristics evaluated include the inability to generate ATP without an external source of energy and the inability to synthesize biomass without adding substrates not known to be needed. Additionally, the MEMOTE (MEtabolic MOdel TEsts) pipeline contains tests to ensure, for example, that biomass precursors can be successfully synthesized in a model in a variety of growth media (47). MEMOTE has been used to ensure appropriate stoichiometry and consistency with accepted format standards in models entered into the BiGG (48) model database. These forms of Quality Control are an important first step in ensuring that models are behaving appropriately and generating useful predictions. However, following these initial checks on functionality, the techniques used to validate actual model predictions are varied and not standardized. Indeed, even in the BiGG database, which is highly curated and focuses primarily on models of microbial systems, models vary in the type and extent of validation performed. Given the variety of validation procedures that appear in the literature, it is important when using an FBA model to be aware of what specific validations were used, what their limitations are, and consequently, what inferences or downstream applications are appropriate (summarized in Table 1).
Table 1:
The most common model validation strategies in Flux Balance Analysis, what these methods tell us, limitations, and important considerations for researchers and/or readers, and examples of these methods’ implementation in the literature.
| Method | Information Content | Limitations | Use case | Examples |
|---|---|---|---|---|
| Comparison of growth/no-growth on one or more substrates | Presence/absence of reactions necessary for substrate utilization and biomass synthesis. | Validation is qualitative, only indicating the existence of metabolic routes. Does not test the accuracy of predicted internal flux values | Useful when viability/nonviability of different growth conditions is of interest. Unlike a growth-rate comparison, does not indicate whether the efficiency of biomass synthesis is realistic. | (51,55,56,60,61) |
| Comparison of growth rates on one or more substrates | Consistency of metabolic network, biomass composition, and maintenance costs with observed efficiency of substrate-to-biomass conversion. | Provides quantitative information on the overall efficiency of substrate conversion to biomass, but is uninformative with respect to the accuracy of internal flux predictions. | When done across multiple substrates and conditions, this validation gives confidence in the predicted efficiency with which the model produces biomass. Useful when identifying growth-limiting factors. | (51,55,60,62) |
| Comparison of in vivo and in silico knockout lethality | Presence/absence of biosynthetic reactions necessary for substrate use and growth. | Care is needed to reduce incorrect predictions from many different factors, including optimization method and biomass composition changes in response to knockout. | Critically important to perform when designing growth-coupled knockout strategies (63–65). | (62,66–68) |
| Comparison of FBA predictions with MFA fluxes | Accuracy of internal flux predictions. | Few MFA flux maps exist for most organisms, making this validation impossible or requiring comparison with an MFA flux map taken for very different experimental conditions. | Important when the intended use of FBA modeling requires that the predictions of specific internal flux values be accurate. | (60,69–71) |
Perhaps the most common validation in FBA is comparison between FBA-predicted and empirically measured rates of growth (e.g. (49–55)). One may similarly evaluate growth/no-growth in different media and/or with different carbon sources (e.g.(51,54–57)). A related approach is the comparison of in silico metabolite uptake/secretion with experimental measurements (54,57,58). Such evaluations give confidence in the model’s basic predictions. To ensure that the accuracy of growth-rate predictions generalizes well, we strongly recommend validating growth rates on substrates or in media conditions from which biomass composition and parameters like Growth-Associated Maintenance (GAM) and Non-Growth Associated Maintenance (NGAM) costs were not experimentally derived, as done in (51). GAM represents the energy expenditure needed to support a certain rate of biomass growth and NGAM represents the energy expenditure required for a cell or organism to survive without any net growth (59). These values may vary depending on growth conditions, so testing whether the values measured in one set of conditions generalize to others is important. Otherwise, future users may use a model with, for example, another common media composition and find – or worse yet, simply not notice – that the resulting predictions do not accurately reflect essential characteristics of the organism’s actual metabolism.
A related approach involves comparing growth/no-growth of gene knockout strains to FBA predictions to address whether the metabolic pathways used in the model mirror the biological system. Experimentally verified lethal knockouts that appear nonlethal in silico point to alternative routes the model can use to grow. Conversely, in silico lethality predictions not confirmed by experiment suggest the model is missing isoforms or alternative reaction routes. Collecting the true positive, true negative, false positive, and false negative predictions from the in silico vs. in vivo lethality predictions into a confusion matrix allows for an at-a-glance evaluation of overall model accuracy and for the comparison of alternative model architectures (68). Researchers sometimes use algorithms to identify knockouts that couple biomass accumulation to flux through a reaction for biotechnological applications (63,65,72). This requires that models accurately predict growth/no-growth phenotypes for gene knockouts, but previous work in a model of Saccharomyces cerevisiae, for example, shows that FBA performs poorly at predicting the synthetic lethality of double-knockouts, making this a serious concern (66). When performing such validations, one must keep in mind that imposed constraints and decisions made during the model construction or optimization process may implicitly or explicitly add the predictions one is trying to validate into the model, rendering the exercise meaningless. This makes clear and transparent documentation of the assumptions used in the modeling process key for reviewers and readers to assess the epistemic value of the validations that are reported.
It is crucial to note that the methods discussed above do not validate the internal flux predictions made by FBA. Due to the underdetermined nature of FBA, many radically different flux maps may be compatible with, for example, the optimization of growth-rate (13), making validations using growth-rate or any other individual external flux uninformative with respect to internal flux distributions. In well-characterized systems, there may be a wealth of known metabolic functionalities that an organism can carry out and evaluating whether the model can reproduce them can give some assurance of realistic model behavior. In (73,74), 288 metabolic processes known to take place in mammalian cells were evaluated in models of human and mouse models, though it was only the ability to carry out the processes at all, and not the actual flux values, that were evaluated. In favorable cases, individual internal fluxes can be quantitatively estimated in vivo using independent methods and compared directly to ones from a predicted flux map to provide a powerful form of validation. For example, in a study from our group (75) the ratio of the cyclic electron flow (CEF) to linear electron flow (LEF) fluxes in photosynthesis predicted by FBA was evaluated against CEF/LEF ratios from fluorescence measurements for validation purposes. Though less specific, the sum of FBA-predicted values for fluxes that produce and/or consume a product (such as CO2) can also be compared to experimental measurements. In addition to these approaches, there is the possibility going forward of integrating metabolomics data into the FBA prediction process (e.g. (76)) and/or comparison of FBA results against metabolomic datasets. Although, it should be noted that metabolite levels and changes in those levels in the steady-state cannot be directly interpreted in terms of fluxes, so any attempts to validate FBA results using observations in metabolomics datasets should be done with caution.
However, validations of internal flux predictions across the network require comparing FBA flux maps with high-quality ones from 13C-MFA. Such validations are the most information-rich of all the methods surveyed so far and tell us the most about how well the FBA flux maps generated by a particular combination of network architecture, constraints, and objective function line up with experimental data. Unfortunately, 13C-MFA flux maps are time-consuming to generate, making this “gold-standard” validation rare. To compare FBA-predicted and MFA-estimated fluxes, the model architectures must be the same, or the MFA must at least be a subnetwork of the model used for the FBA. Additionally, the empirical constraints (e.g. substrate uptake and biomass accumulation) must be the same in both cases. In cases where the growth rates predicted or constrained for an FBA flux map do not perfectly line up with those from an MFA flux map, normalization of fluxes to account for this discrepancy can be used to get an apples-to-apples comparison (69). The imposition of identical external flux constraints on both the FBA and MFA models may preclude validation of the accuracy of certain external flux predictions by the FBA. However, such comparisons can be done afterwards by removing the relevant constraints. Comparison is also complicated by the underdetermined nature of most FBA optimizations, which can result in large feasible ranges for the individual fluxes being compared against the corresponding flux values obtained from 13C-MFA, making the validation less stringent. FBA optimizations that assume parsimony (11,77) tend to yield narrower flux ranges, but this advantage may come at the cost of neglecting other plausible objective functions that might be more accurate.
Finally, when FBA-predicted and MFA-estimated flux maps disagree, assuming the experimental constraints are consistent between the two and that the person doing the comparison is confident in the MFA estimates, either the FBA network architecture or objective function could be to blame. There is not, to our knowledge, a consistent strategy for disambiguating disagreements due to architecture or objective function. If the biological/biochemical accuracy of the objective function is in question, methods for inferring objective functions using isotopic labeling data can be employed (e.g. (78)), the resulting objective functions can be compared with the one being used, and discrepancies can be considered. All objective functions that relate to growth will be affected by the accuracy of the biomass composition used in the model, although in some systems central metabolic fluxes may be relatively robust to variability in the exact values of this composition (79). In systems for which extensive biomass composition data is available, known variability in biomass composition can be incorporated during the optimization process (39). Despite these various limitations and difficulties when validating FBA using 13C-MFA fluxes, some studies have evaluated the accuracy of FBA against 13C-MFA-estimated flux maps (e.g. (22,54,60,70,80–82)), with mixed results.
A consistent challenge when validating FBA fluxes using any method is the need to compare the FBA flux map against empirical fluxes or other measurements that were generated under similar conditions to those being simulated. For organisms or systems whose metabolic models are undergoing continual refinement, thus requiring repeated validation, community-curated and updated validation datasets generated under well-defined and carefully reported conditions may be useful. Standards on what metabolic phenotypes and responses need to be captured by these models (e.g. the 288 known metabolic functions in human cells used in (73)) may also help ensure that reconstructions maintain essential biological features as they grow larger and more detailed.
To summarize, we make the following recommendations for the validation of FBA-predicted flux maps:
- When possible, comparisons between FBA-predicted and 13C-MFA-estimated flux maps should be performed to validate the accuracy of FBA-predicted internal fluxes. This provides a greater wealth of information about where and to what extent the model is, and is not, lining up with experimental evidence. When performing such validations, care should be taken to ensure that the conditions under which the FBA-predictions and MFA-estimates are generated are as similar as possible and that any necessary normalizations to account for differences have been made. For an example of thorough FBA-to-MFA comparisons, see (69,83).
- Note: FBA-predicted flux maps require definition not just of the network architecture and constraints, but also an objective function for optimization. Validation of the FBA-predicted flux maps is therefore also a validation of the selected objective function. It is possible for a poorly selected objective function to generate flux predictions that do not align with MFA-estimated fluxes; in such cases, alternative objective functions can be explored.
As highlighted in Table 1, different validation methods evaluate different aspects of the model’s predictions. Therefore, employing a number of different validations allows for a fuller and more detailed analysis of model performance and increases the likelihood that other users of the model may be able to appropriately apply it to their research question. For an example of a study employing several different validation techniques, see (57).
Validations of model predictions are only valuable when the data the predictions are validated against has not already been used in the training or construction of the model. The complexity of the metabolic model reconstruction and analysis process can make it difficult to notice when contamination of the validation dataset by training data has occurred. In order to identify contamination, one must consider the source of all data used for validation and consider whether it or a value derived from it was used at any stage of the FBA modeling process. For an example of a study that clearly and systematically validates FBA predictions while avoiding such contamination, see (51).
Improving confidence in the accuracy of FBA flux maps is valuable because generating validated 13C-MFA flux maps for all systems and conditions of interest is impractical. 13C-MFA requires substantial experimental work for each set of conditions and is unsuitable for many multicellular tissues and organisms where the required combination of extended periods of metabolic steady state, controlled provision of informative, non-perturbing labeled substrates, and obtaining enough labeling data cannot be achieved. This FBA-empowered future for systems biology and biotechnology requires well-validated MFA flux maps, so we turn our attention to model validation and selection in MFA.
Validation in 13C-MFA
13C-MFA flux estimates are typically validated based on the goodness-of-fit between measured labeling data and the corresponding values generated by the network model after the optimization of model parameters. The goodness-of-fit is represented by the sum of squared residuals (SSR) where each residual is weighted by dividing it by its experimental variance. The χ2-test of goodness-of-fit, which is built into commonly used 13C-MFA software (84–86), is then used to test whether the SSR falls within the 95% confidence interval expected for the defined number of degrees of freedom (DOF). Since its development as a validation method in 13C-MFA (26), the χ2-test has been widely used and has been useful in the validation of 13C-MFA metabolic models inferred from genome annotations (87–93).
However, as described in (94) and (27), the use of the χ2-test can be problematic in 13C-MFA for several reasons. When upper- and lower-bounds are imposed on estimated flux parameter values, this makes accurate estimation of the effective DOF for the χ2-test difficult (27). It can also be difficult to accurately determine errors in the MID measurements made for 13C-MFA, resulting in distortion of the variance-weighted SSR values that are being compared against the 95% Confidence Interval (94).
In addition to these technical difficulties with properly applying the χ2-test, problems arise from how the test is implemented into the model development process during a typical 13C-MFA study. Especially for eukaryotic systems, 13C-MFA flux modeling generally involves making iterative changes to the model based on how well it can explain the data – as assessed informally and by the χ2-test – followed by refinement and assessment of the data based on this agreement. For example, if the data do not allow the fluxes between the same metabolite in different compartments to be determined, they may be merged in the model or additional measurements may be made to resolve them. Metabolites may also be excluded from the model due to inconsistency between their simulated vs. measured MIDs causing the model to fail the χ2-test, on the assumption that biological, model-structural, or analytical uncertainties underlie these unexplained divergences (95)1. The difficulty of accurately quantifying MID measurement errors, mentioned earlier, may be addressed by arbitrarily increasing the assumed measurement error, which reduces the deduced precision of flux estimates to take into account the potential for error sources not accounted for by experimentally observed scatter (94–96)1. This process is a natural consequence of the diversity and uncertainty of the metabolic architecture of different systems and is a valid form of exploratory data analysis and model building. However, altering the model by excluding specific data points and adding additional fluxes or metabolites until the χ2-test passes, and then relying on this very same test as validation is statistically dubious from a rigorous perspective. As in the case of an FBA model validation in which the prediction being validated has been implicitly introduced to the model itself, a final validation of a 13C-MFA model with the same data used to make it acceptable, as quantified by the χ2-test, does not constitute a real validation. It also can naturally lead to over- or under-fit models, which we discuss below in the section on model selection.
Due to these difficulties, we propose that the χ2-test, as it is currently used, should be used as one of multiple lines of evidence to consider when validating a 13C-MFA model, especially for less defined and/or more complex eukaryotic systems such as plants. One way to address the issue of using the χ2-test for both model development and validation is to reserve a portion of the dataset only for final model validation. This practice of holding out a subset of the data to be used exclusively for validation is standard statistical practice (41) in other areas of systems biology and, conveniently, can also be used for model selection (94).
In the absence of direct experimentally measurable fluxes, independent measurements that can be measured or inferred from empirical measurements in vivo provide an important ground-truth value to compare with flux estimates and can complement the use of the χ2-test for validation. An example of this can be found in the plant 13C-MFA literature, where independent measurements of the relative rates of oxygenation and carboxylation by the enzyme RuBisCO can be compared with 13C-MFA flux estimates (95–97). In (96) for example, our group compared predicted values for the relative rates of oxygenation and carboxylation by the enzyme RuBisCO in photosynthesis versus inferred values from stomatal conductance and other empirical measurements. This led us to conclude that labeling data from whole tissue extracts was insufficient to accurately estimate photorespiratory fluxes without information on the compartmentation of certain metabolites. Despite the strength of this form of validation, it is infrequently practiced.
Another little-used but potentially valuable approach to validation is the corroboration of key features of 13C-MFA models using independent modeling methods. In (95), simplified compartmental kinetic models yielded analytical solutions predicting that overall labeling time courses should take the form of sums of exponential rate components. Fitting labeling data to these exponential models and applying statistical model selection techniques provided independent corroboration of the overall architecture of the 13C-MFA model that was used to obtain a detailed flux map.
Returning to goodness-of-fit, one must also keep in mind what information is taken into consideration and the effect of the assumed network architecture. In INST-MFA, where time-course labeling data is used, metabolite pool sizes are both estimable parameters and constrainable modeling inputs. When pool sizes are not provided as empirical measurements, pool size estimates are typically imprecise and inaccurate (98). The inaccuracy of these estimates is not usually interpreted as an impediment to publishing 13C-MFA results and according to (98), leaving out pool size information does not adversely affect flux estimate accuracy. Flux estimates are not, however, always robust against misspecifications of the network model (94). The exclusion of pool size information provides greater flexibility in fitting experimental data, allowing robustness against model misspecifications at the expense of not detecting them (98). A useful next step for this field would be to routinely measure and include pool size estimates to improve the detection of incorrect model architectures. Measurement of all metabolites in a way that allows discrimination of pools for identical metabolites in different cellular compartments requires a method like Non-Aqueous Fractionation (e.g. (99)), which may be prohibitively difficult to implement in many studies. In such cases, use of a strategically selected set of metabolite levels may be used to allow for improved detection of incorrect model architectures. This introduces the matter of model selection.
Model Selection in 13C-MFA
As discussed earlier, model development in 13C-MFA is an iterative process. Alternate models developed during this process may differ in their numbers of reactions and metabolites, resulting in different DOF. Adding model parameters can result in overfitting when these extra DOF lead the 13C-MFA optimization to fit noise rather than biological signal. Model selection techniques can be used to avoid this overfitting and to select the most statistically supported model among alternatives. The development of FBA models can also involve deciding between alternative architectures. However, comparison and selection of such models from sets of alternatives based on their predictions’ deviations from empirical measurements is uncommon, so we focus our attention on 13C-MFA.
Model misspecification can result in missing important fluxes, incorrectly estimating the rates of modeled fluxes, or incorrectly estimating the precision of flux estimates. In a study our group performed of central metabolic fluxes in the oilseed crop Camelina sativa (95), previously published model architectures that passed the χ2-test of goodness-of-fit (96) were nonetheless shown to be missing an important set of metabolic reactions involving the movement of carbohydrates to and from the vacuole. In (94), in silico examples of sub-optimal model selection resulting in flux estimates that fall outside of the 95% confidence intervals for those same fluxes generated using the correct model architecture are provided, showing the potential for biased flux estimates when model selection is not properly performed. Finally, the literature on “Genome-scale-13C-MFA” has provided evidence that the exclusion of many reactions peripheral to the metabolic network under consideration (typically core metabolism) in 13C-MFA can result in artificially narrow confidence intervals. Genome-scale-13C-MFA involves estimating a flux map by minimizing deviation between predicted and measured isotopic labeling but using the kind of genome-scale metabolic network more typically used for FBA analyses (100,101). In studies on the cyanobacterium Synechococcus elongatus (102,103), it has been shown that the substantially larger genome-scale 13C-MFA models achieved better fits to the labeling data, that these reductions in SSR were statistically justified, and that the original models of core metabolism underestimated the uncertainty in a number of flux estimates by ignoring alternative metabolic pathways that could also explain patterns in the labeling data (101). The examples above demonstrate that rather than being a statistical curiosity, model selection (or the lack thereof) can have serious implications for the accuracy and reliability of flux modeling results.
Several approaches to model selection can be found in the 13C-MFA literature, with different approaches being taken in different studies. The simplest is selecting the model with the smallest SSR. This method does not work when the DOF of the compared models are different, as increasing the DOF in a model inevitably allows it to fit a given data set better. This may be accounted for informally by noting the change in DOF (e.g. (95)), or in a more statistically rigorous way using the extra-sum-of-squares test (104,105) or information criteria (106,107). The most common model selection approach used in 13C-MFA is an informal method using the χ2-test, wherein models are iteratively modified until a model and dataset pass the test, or where several alternative models are evaluated and the one that passes the test by the widest margin is selected (43,44,94,108). These approaches have been used, for example, to demonstrate that the isotopic labeling data of co-culture systems cannot be adequately described by modeling with a single-culture 13C-MFA model (109,110), to provide evidence for the operation of previously undescribed fluxes in mammalian cells (111), and to detect missing reactions in metabolic network reconstructions from genome annotations or that are needed to describe the metabolism of mutant E. coli strains (81,87).
However, the previously mentioned limitations of the χ2-test for model validation also affect its usefulness for model selection and models failing the test due to these limitations can lead to the addition of statistically unjustified metabolites or reactions to the model until it passes (94). We refer to the χ2-test-based methods as “informal” model selection because when multiple models are evaluated, they are not directly or formally compared to determine whether the additional parameters in more complex models are statistically justified, which can naturally lead to the selection of overfit models.
The general approach of avoiding overfitting by evaluating models based on their performance on a set of data not used during the fitting process is widely used in statistics (e.g. cross-validation techniques (112)). The validation-based approach taken in (94) implements this best practice, separating fitting and testing data sets to avoid the pitfalls discussed above. In our view, this represents a substantial advancement in model selection in 13C-MFA. This method divides the labeling dataset into training and validation subsets and then estimates fluxes in alternative models using the training data. These alternative models’ flux maps, and their accompanying predicted MIDs, are then compared based on their agreement with the validation MID data. The model whose flux map results in the smallest SSR when compared with this validation data is selected. The authors generated synthetic labeling data from a predefined “correct” model and assessed the ability of their new method and other model selection techniques to identify this correct model from a set of alternatives. The validation-based approach accomplishes this more consistently than existing model selection methods, including χ2-test-based methods, and does so irrespective of the value of the measurement error in the labeling datasets. The incorrect models selected by other methods contain flux estimates that fall outside the 95% confidence intervals of the fluxes from the correct model, highlighting the importance of model selection for obtaining accurate flux estimates (94). The generation of MID data in additional labeling experiments to precisely measure all fluxes in a network (28–35) provides the reserved validation datasets needed for (94). This means that for 13C-MFA studies that already require a parallel labeling approach, implementation of this more rigorous model selection approach is simply a matter of setting aside a subset of data to evaluate alternative model architectures.
This approach can be extended in INST-MFA by using metabolite pool size measurements in the selection process. Individual pool sizes are sensitive to the local kinetic parameters and will fit poorly when reaction networks are incompletely specified (98). We therefore suggest that validation-based model selection using pool size measurements as input measurements is a promising prospective model selection approach for INST MFA (Figure 2). Indeed, although not referred to explicitly as model selection, in (98) the authors show that inclusion of pool size information results in an incorrectly specified network architecture failing to pass the χ2-test of goodness-of-fit, whereas a correctly specified network does pass. This corresponds to the “first to pass χ2” method of model selection discussed in (94) and is subject to the various limitations of the χ2-test as a model selection technique covered earlier. By incorporating these metabolite pool sizes into the formalized model selection framework described in (94), we may arrive at a more robust form of model selection that is better at detecting misspecified networks. As the authors of (94) note, the optimal model selected by their method should be subjected to a final validation to assess model quality. A model architecture may be selected by the model selection process but result in a substantial deviation of some metric from independently measured values. For this final validation, a combination of the χ2-test, independent experimental measurements, and alternative modeling approaches can be used. Keeping in mind both the trade-off between goodness-of-fit and model complexity and the multiple ways in which 13C-MFA model predictions can be validated will ensure that flux estimates are as accurate and robust as possible.
Figure 2:
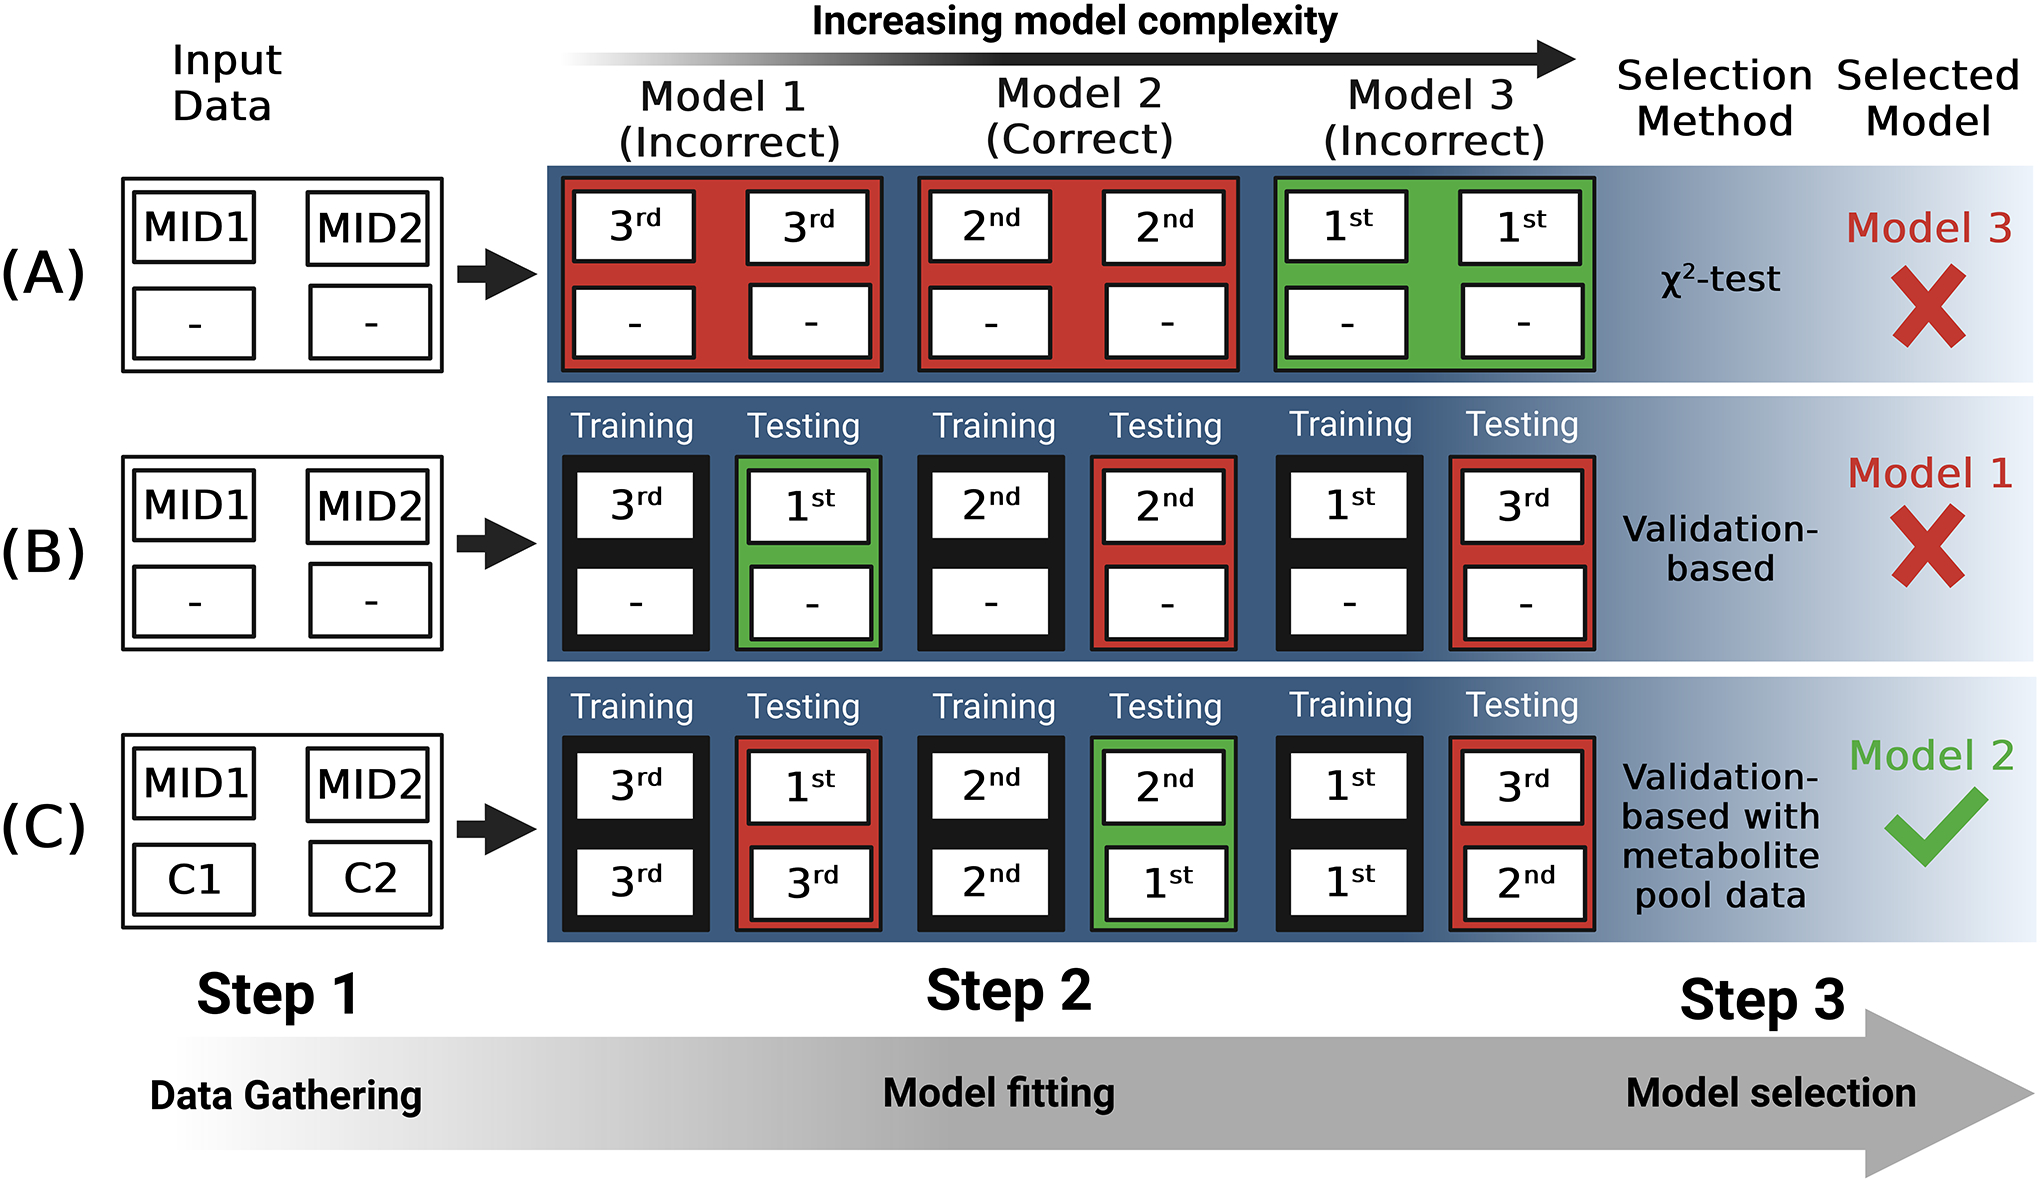
Approaches to model selection for 13C-MFA. Metabolic network models 1–3 having increasing complexity are compared. Model 2 in this example is the correct description of the network. (A) Labeling data (MID1 & MID2) are gathered and, for each model, agreement between model output and these data is optimized. The χ2-test of goodness-of-fit is used to assess each model fit and these model fits are ranked 1st, 2nd, or 3rd, with the 1st passing the test by the widest margin and being selected as the most statistically well-supported model. (B) Labeling data are split into “training” and “testing” subsets and agreement between model output and the “training” data is optimized. The Sum-of-Squared Residuals (SSR) is then calculated for each model from the deviation between its output and the “testing” data. The model fits are then ranked 1st, 2nd, and 3rd, with the 1st having the lowest SSR and being selected. (C) Labeling data and metabolite pool data (C1 and C2) are gathered and split into “training” and “testing” subsets. For each model, agreement between model output and these data is optimized. The Sum-of-Squared Residuals (SSR) is then calculated for each model from the deviation between its output and the “testing” data. The model fits are then ranked 1st, 2nd, and 3rd, with the 1st having the lowest SSR and being selected. The inclusion of metabolite pool size data into both the “fitting” and “testing” datasets provides more data to go off when evaluating goodness-of-fit, potentially increasing the likelihood of identifying the correct model from a set of alternatives.
Model validation and selection are an integral part of the 13C-MFA process. Notably, model selection practices like the use of validation-based model selection (94) and the use of the extra-sum-of-squares test (105) to compare alternative model architectures represent, in our view, a major improvement over exclusive use of the χ2-test of goodness-of-fit test for both purposes, but are seldom practiced in the literature. We encourage the use of these techniques and believe they hold promise for improving confidence in both the fluxes and network architectures reported in studies.
With respect to validation and model selection in MFA, we recommend the following:
As highlighted in (44), transparency is key in 13C-MFA, given the assumptions that must be satisfied for 13C-MFA modeling as well as the sensitivity of flux estimates to model architecture. As an example of a transparently reported 13C-MFA study, see (113).
The validation and selection of MFA-estimated fluxes, like the validation of any model output, benefits from multiple lines of corroborating evidence. When possible, the use of alternative modeling approaches of isotopic labeling data can be a powerful tool for arriving at well-supported model architectures, as in (95).
In INST-MFA, metabolite pool size measurements can be used to provide additional confidence in model validity and tighten flux confidence intervals (114), as well as provide additional measurements for validation-based model selection. However, practitioners should be aware that these measurements can make model fits highly sensitive to incorrectly specified network models in ways that may or may not affect the accuracy of flux estimates (98). Additionally determination of subcellular compartmentation of certain metabolites may be prohibitively difficult in some cases. In such cases, key metabolites with known subcellular compartmentation may be measured.
We recommend the use of a proper model selection framework to compare alternative, biochemically reasonable model architectures when performing 13C-MFA modeling. The framework outlined in (94) represents the state-of-the-art in this area. Barring the application of that method, a more traditional model selection approach, such as the extra-sum-of-squares approach used in (105) can be employed.
Future Directions
We believe that validation and selection deserve greater attention from the flux analysis community and suggest that implementing the approaches highlighted in this perspective will improve the accuracy and reliability of constraints-based metabolic modeling and flux estimates. However, we also recognize that some approaches suggested here, such as the use of pool size measurements, can be extremely difficult to implement in practice. A recent publication on isotopically non-stationary MFA of Arabidopsis thaliana heterotrophic cell culture metabolism highlighted that although pool size data could potentially be used to improve the accuracy and precision of flux predictions, the experimental difficulty of measuring the concentrations of metabolites distributed across multiple subcellular compartments made this prohibitively difficult (115). As in all areas of science, then, the development of consensus best practices in the evaluation of and inference from data and models must arise at the intersection of rigorous statistical theory and experimental practicalities. However, we believe that researchers engaged in constraint-based metabolic modeling as well as readers of modeling studies benefit when the limitations of present validation and selection practices are clarified.
Several matters call for investigation before definitive recommendations can be made on best practices. At present, it is not clear how to appropriately weight the contributions to flux estimation of unambiguous direct flux measurements like substrate uptake, which typically have relatively large standard deviations, against MIDs, which frequently have much smaller standard deviations but whose relationship to fluxes depends on model structure and whose measured values may be offset by unknown analytical effects. Likewise, it is unclear how best to deal with those not infrequent MID measurements that have extremely small, but imprecisely measured, standard deviations, which can exert too much control over the fitting process.
Finally, we would like to conclude by emphasizing that the process of careful validation and model selection can lead to the generation of models that are not only more quantitatively sound, but that yield exciting scientific insights (e.g. (110,111)).
Acknowledgments
This research was supported by the Office of Science (BER), U.S. Department of Energy, Grant no DE-SC0018269 (J.A.M.K., Y.S-H.). This work is supported, in part, by the NSF Research Traineeship Program (Grant DGE-1828149) to J.A.M.K. This publication was also made possible by a predoctoral training award to J.A.M.K. from Grant T32-GM110523 from National Institute of General Medical Sciences (NIGMS) of the NIH. Its contents are solely the responsibility of the authors and do not necessarily represent the official views of the NIGMS or NIH. Figures made using BioRender.com.
Footnotes
Conflict of Interest Disclosure
The authors have no conflicts of interest to disclose.
Here we primarily cite our own work because, as discussed, there are a number of sound reasons for leaving out metabolites and/or increasing MID measurement errors. We have chosen not to highlight other studies that have employed the same practices since we do not know all of the experimental and analytical details underlying them and would not want their inclusion here to be interpreted as implicit criticism.
Data Availability Statement
No data was generated as part of this study.
References
- 1.Nielsen J It Is All about Metabolic Fluxes. Journal of Bacteriology. 2003;185(24):7031–5. [DOI] [PMC free article] [PubMed] [Google Scholar]
- 2.Spivey A Systems biology: the big picture. Environmental health perspectives. 2004;112(16):938–43. [DOI] [PMC free article] [PubMed] [Google Scholar]
- 3.Koffas MAG, Jung GY, Stephanopoulos G. Engineering metabolism and product formation in Corynebacterium glutamicum by coordinated gene overexpression. Metabolic Engineering. 2003;5(1):32–41. [DOI] [PubMed] [Google Scholar]
- 4.Koffas MAG, Stephanopoulos G. Strain improvement by metabolic engineering: Lysine production as a case study for systems biology. Current Opinion in Biotechnology. 2005;16(3 SPEC. ISS.):361–6. [DOI] [PubMed] [Google Scholar]
- 5.Becker J, Zelder O, Häfner S, Schröder H, Wittmann C. From zero to hero-Design-based systems metabolic engineering of Corynebacterium glutamicum for l-lysine production. Metabolic Engineering. 2011;13(2):159–68. [DOI] [PubMed] [Google Scholar]
- 6.Gleizer S, Ben-Nissan R, Bar-On YM, Antonovsky N, Noor E, Zohar Y, et al. Conversion of Escherichia coli to Generate All Biomass Carbon from CO2. Cell. 2019;179(6):1255–1263.e12. [DOI] [PMC free article] [PubMed] [Google Scholar]
- 7.Antoniewicz MR. Methods and advances in metabolic flux analysis: a mini-review. Journal of Industrial Microbiology and Biotechnology. 2015;42(3):317–25. [DOI] [PubMed] [Google Scholar]
- 8.Cheah YE, Young JD. Isotopically nonstationary metabolic flux analysis (INST-MFA): putting theory into practice. Current Opinion in Biotechnology. 2018;54:80–7. [DOI] [PubMed] [Google Scholar]
- 9.Jazmin LJ, Beckers V, Young JD. User Manual for INCA. 2014.
- 10.Orth JD, Thiele I, Palsson BO. What is flux balance analysis? Nature Biotechnology. 2010;28(3):245–8. [DOI] [PMC free article] [PubMed] [Google Scholar]
- 11.Holzhütter HG. The principle of flux minimization and its application to estimate stationary fluxes in metabolic networks. European Journal of Biochemistry. 2004;271(14):2905–22. [DOI] [PubMed] [Google Scholar]
- 12.Schnitzer B, Österberg L, Cvijovic M. The choice of the objective function in flux balance analysis is crucial for predicting replicative lifespans in yeast. PLOS ONE. 2022. Oct;17(10):1–15. [DOI] [PMC free article] [PubMed] [Google Scholar]
- 13.Mahadevan R, Schilling CH. The effects of alternate optimal solutions in constraint-based genome-scale metabolic models. Metabolic Engineering. 2003;5(4):264–76. [DOI] [PubMed] [Google Scholar]
- 14.Haraldsdóttir HS, Cousins B, Thiele I, Fleming RMT, Vempala S. CHRR: Coordinate hit-and-run with rounding for uniform sampling of constraint-based models. Bioinformatics. 2017;33(11):1741–3. [DOI] [PMC free article] [PubMed] [Google Scholar]
- 15.Megchelenbrink W, Huynen M, Marchiori E. optGpSampler: An improved tool for uniformly sampling the solution-space of genome-scale metabolic networks. PLoS ONE. 2014;9(2). [DOI] [PMC free article] [PubMed] [Google Scholar]
- 16.Schellenberger J, Palsson B. Use of randomized sampling for analysis of metabolic networks. Journal of Biological Chemistry. 2009;284(9):5457–61. [DOI] [PubMed] [Google Scholar]
- 17.Bordel S, Agren R, Nielsen J. Sampling the solution space in genome-scale metabolic networks reveals transcriptional regulation in key enzymes. PLoS Computational Biology. 2010;6(7):16. [DOI] [PMC free article] [PubMed] [Google Scholar]
- 18.Segrè D, Vitkup D, Church GM. Analysis of optimality in natural and perturbed metabolic networks. Proceedings of the National Academy of Sciences of the United States of America. 2002;99(23):15112–7. [DOI] [PMC free article] [PubMed] [Google Scholar]
- 19.Shlomi T, Berkman O, Ruppin E. Regulatory on/off minimization of metabolic flux changes after genetic perturbations. Proceedings of the National Academy of Sciences. 2005. May 24;102(21):7695–700. [DOI] [PMC free article] [PubMed] [Google Scholar]
- 20.Åkesson M, Förster J, Nielsen J. Integration of gene expression data into genome-scale metabolic models. Metabolic Engineering. 2004;6(4):285–93. [DOI] [PubMed] [Google Scholar]
- 21.Becker SA, Palsson BO. Context-specific metabolic networks are consistent with experiments. PLoS Computational Biology. 2008;4(5). [DOI] [PMC free article] [PubMed] [Google Scholar]
- 22.Tian M, Reed JL. Integrating proteomic or transcriptomic data into metabolic models using linear bound flux balance analysis. Bioinformatics. 2018;34(22):3882–8. [DOI] [PMC free article] [PubMed] [Google Scholar]
- 23.Pandey V, Hadadi N, Hatzimanikatis V. Enhanced flux prediction by integrating relative expression and relative metabolite abundance into thermodynamically consistent metabolic models. PLOS Computational Biology. 2019;15(5):1–23. [DOI] [PMC free article] [PubMed] [Google Scholar]
- 24.Ravi S, Gunawan R. ΔFBA—Predicting metabolic flux alterations using genome-scale metabolic models and differential transcriptomic data. PLOS Computational Biology. 2021. Nov 10;17(11):e1009589. [DOI] [PMC free article] [PubMed] [Google Scholar]
- 25.Orth JD, Fleming RMT, Palsson BØ. Reconstruction and Use of Microbial Metabolic Networks: the Core Escherichia coli Metabolic Model as an Educational Guide. EcoSal Plus [Internet]. 2010. Feb 1;4(1). Available from: 10.1128/ecosalplus.10.2.1 [DOI] [PubMed] [Google Scholar]
- 26.Antoniewicz MR, Kelleher JK, Stephanopoulos G. Determination of confidence intervals of metabolic fluxes estimated from stable isotope measurements. Metabolic Engineering. 2006;8(4):324–37. [DOI] [PubMed] [Google Scholar]
- 27.Theorell A, Leweke S, Wiechert W, Nöh K. To be certain about the uncertainty: Bayesian statistics for 13C metabolic flux analysis. Biotechnology and Bioengineering. 2017;114(11):2668–84. [DOI] [PubMed] [Google Scholar]
- 28.Crown SB, Long CP, Antoniewicz MR. Optimal tracers for parallel labeling experiments and (13)C metabolic flux analysis: A new precision and synergy scoring system. Metabolic engineering. 2016. Nov;38:10–8. [DOI] [PMC free article] [PubMed] [Google Scholar]
- 29.Crown SB, Long CP, Antoniewicz MR. Integrated 13C-metabolic flux analysis of 14 parallel labeling experiments in Escherichia coli. Metabolic engineering. 2015. Mar;28:151–8. [DOI] [PMC free article] [PubMed] [Google Scholar]
- 30.Leighty RW, Antoniewicz MR. COMPLETE-MFA: Complementary parallel labeling experiments technique for metabolic flux analysis. Metabolic Engineering. 2013;20:49–55. [DOI] [PubMed] [Google Scholar]
- 31.Crown SB, Antoniewicz MR. Selection of tracers for 13C-Metabolic Flux Analysis using Elementary Metabolite Units (EMU) basis vector methodology. Metabolic Engineering. 2012;14(2):150–61. [DOI] [PMC free article] [PubMed] [Google Scholar]
- 32.Crown SB, Ahn WS, Antoniewicz MR. Rational design of 13C-labeling experiments for metabolic flux analysis in mammalian cells. BMC Systems Biology. 2012;6(1):43. [DOI] [PMC free article] [PubMed] [Google Scholar]
- 33.Chang Y, Suthers PF, Maranas CD. Identification of optimal measurement sets for complete flux elucidation in metabolic flux analysis experiments. Biotechnology and Bioengineering. 2008;100(6):1039–49. [DOI] [PubMed] [Google Scholar]
- 34.Beyß M, Parra-Peña VD, Ramirez-Malule H, Nöh K. Robustifying Experimental Tracer Design for13C-Metabolic Flux Analysis. Frontiers in Bioengineering and Biotechnology. 2021;9(June). [DOI] [PMC free article] [PubMed] [Google Scholar]
- 35.Millard P, Sokol S, Letisse F, Portais JC. IsoDesign: A software for optimizing the design of 13C-metabolic flux analysis experiments. Biotechnology and Bioengineering. 2014;111(1):202–8. [DOI] [PubMed] [Google Scholar]
- 36.Wang Y, Hui S, Wondisford FE, Su X. Utilizing tandem mass spectrometry for metabolic flux analysis. Laboratory Investigation. 2021. Apr 1;101(4):423–9. [DOI] [PMC free article] [PubMed] [Google Scholar]
- 37.Choi J, Antoniewicz MR. Tandem mass spectrometry for 13C metabolic flux analysis: Methods and algorithms based on EMU framework. Frontiers in Microbiology. 2019;10:31. [DOI] [PMC free article] [PubMed] [Google Scholar]
- 38.Dinh HV, Sarkar D, Maranas CD. Quantifying the propagation of parametric uncertainty on flux balance analysis. Metabolic Engineering. 2022;69:26–39. [DOI] [PubMed] [Google Scholar]
- 39.Choi YM, Choi DH, Lee YQ, Koduru L, Lewis NE, Lakshmanan M, et al. Mitigating biomass composition uncertainties in flux balance analysis using ensemble representations. Computational and Structural Biotechnology Journal. 2023. Jan 1;21:3736–45. [DOI] [PMC free article] [PubMed] [Google Scholar]
- 40.Bernstein DB, Sulheim S, Almaas E, Segrè D. Addressing uncertainty in genome-scale metabolic model reconstruction and analysis. Genome Biology. 2021. Feb 18;22(1):64. [DOI] [PMC free article] [PubMed] [Google Scholar]
- 41.Gross F, MacLeod M. Prospects and problems for standardizing model validation in systems biology. Progress in Biophysics and Molecular Biology. 2017;129:3–12. [DOI] [PubMed] [Google Scholar]
- 42.Kirk P, Thorne T, Stumpf MPH. Model selection in systems and synthetic biology. Current Opinion in Biotechnology. 2013;24(4):767–74. [DOI] [PubMed] [Google Scholar]
- 43.Long CP, Antoniewicz MR. High-resolution (13)C metabolic flux analysis. Nature protocols. 2019. Oct;14(10):2856–77. [DOI] [PubMed] [Google Scholar]
- 44.Antoniewicz MR. A guide to 13C metabolic flux analysis for the cancer biologist. Experimental and Molecular Medicine [Internet]. 2018;50(4). Available from: 10.1038/s12276-018-0060-y [DOI] [PMC free article] [PubMed] [Google Scholar]
- 45.Heirendt L, Arreckx S, Pfau T, Mendoza SN, Richelle A, Heinken A, et al. Creation and analysis of biochemical constraint-based models using the COBRA Toolbox v.3.0. Nature Protocols. 2019;14(3):639–702. [DOI] [PMC free article] [PubMed] [Google Scholar]
- 46.Ebrahim A, Lerman JA, Palsson BO, Hyduke DR. COBRApy: COnstraints-Based Reconstruction and Analysis for Python. BMC Systems Biology. 2013;7. [DOI] [PMC free article] [PubMed] [Google Scholar]
- 47.Lieven C, Beber ME, Olivier BG, Bergmann FT, Ataman M, Babaei P, et al. MEMOTE for standardized genome-scale metabolic model testing. Nature Biotechnology. 2020;38(3):272–6. [DOI] [PMC free article] [PubMed] [Google Scholar]
- 48.Norsigian CJ, Pusarla N, McConn JL, Yurkovich JT, Dräger A, Palsson BO, et al. BiGG Models 2020: multi-strain genome-scale models and expansion across the phylogenetic tree. Nucleic Acids Research. 2020. Jan 8;48(D1):D402–6. [DOI] [PMC free article] [PubMed] [Google Scholar]
- 49.Varma A, Palsson BO. Stoichiometric flux balance models quantitatively predict growth and metabolic by-product secretion in wild-type Escherichia coli W3110. Applied and Environmental Microbiology. 1994;60(10):3724–31. [DOI] [PMC free article] [PubMed] [Google Scholar]
- 50.Schroeder WL, Saha R. Introducing an Optimization- and explicit Runge-Kutta- based Approach to Perform Dynamic Flux Balance Analysis. Scientific Reports. 2020;10(1):1–28. [DOI] [PMC free article] [PubMed] [Google Scholar]
- 51.Arion IS, Hiroyuki O, Matti G, Ghita G, Kapil A, X. CO, et al. A Genome-Scale Metabolic Model of Marine Heterotroph Vibrio splendidus Strain 1A01. mSystems. 2023. Feb 28;0(0):e00377–22. [DOI] [PMC free article] [PubMed] [Google Scholar]
- 52.Feierabend M, Renz A, Zelle E, Nöh K, Wiechert W, Dräger A. High-Quality Genome-Scale Reconstruction of Corynebacterium glutamicum ATCC 13032. Frontiers in microbiology. 2021;12:750206. [DOI] [PMC free article] [PubMed] [Google Scholar]
- 53.Noecker C, Sanchez J, Bisanz JE, Escalante V, Alexander M, Trepka K, et al. Systems biology elucidates the distinctive metabolic niche filled by the human gut microbe Eggerthella lenta. PLOS Biology. 2023. May 19;21(5):e3002125. [DOI] [PMC free article] [PubMed] [Google Scholar]
- 54.Blázquez B, San León D, Rojas A, Tortajada M, Nogales J. New Insights on Metabolic Features of Bacillus subtilis Based on Multistrain Genome-Scale Metabolic Modeling. International Journal of Molecular Sciences. 2023;24(8). [DOI] [PMC free article] [PubMed] [Google Scholar]
- 55.Tec-Campos D, Posadas C, Tibocha-Bonilla JD, Thiruppathy D, Glonek N, Zuñiga C, et al. The genome-scale metabolic model for the purple non-sulfur bacterium Rhodopseudomonas palustris Bis A53 accurately predicts phenotypes under chemoheterotrophic, chemoautotrophic, photoheterotrophic, and photoautotrophic growth conditions. PLOS Computational Biology. 2023. Aug 9;19(8):e1011371. [DOI] [PMC free article] [PubMed] [Google Scholar]
- 56.Ong W, Vu TT, Lovendahl KN, Llull JM, Serres MH, Romine MF, et al. Comparisons of Shewanella strains based on genome annotations, modeling, and experiments. BMC Systems Biology. 2014. Mar 12;8(1):31. [DOI] [PMC free article] [PubMed] [Google Scholar]
- 57.Heinken A, Hertel J, Acharya G, Ravcheev DA, Nyga M, Okpala OE, et al. Genome-scale metabolic reconstruction of 7,302 human microorganisms for personalized medicine. Nature Biotechnology [Internet]. 2023. Jan 19; Available from: 10.1038/s41587-022-01628-0 [DOI] [PMC free article] [PubMed] [Google Scholar]
- 58.Heinken A, Magnúsdóttir S, Fleming RMT, Thiele I. DEMETER: efficient simultaneous curation of genome-scale reconstructions guided by experimental data and refined gene annotations. Bioinformatics. 2021. Nov 5;37(21):3974–5. [DOI] [PMC free article] [PubMed] [Google Scholar]
- 59.Thiele I, Palsson B. A protocol for generating a high-quality genome-scale metabolic reconstruction. Nature Protocols. 2010;5(1):93–121. [DOI] [PMC free article] [PubMed] [Google Scholar]
- 60.Coppens L, Tschirhart T, Leary DH, Colston SM, Compton JR, Hervey IV WJ, et al. Vibrio natriegens genome-scale modeling reveals insights into halophilic adaptations and resource allocation. Molecular Systems Biology. 2023. Feb 27;19:e10523. [DOI] [PMC free article] [PubMed] [Google Scholar]
- 61.Pinchuk GE, Hill EA, Geydebrekht OV, de Ingeniis J, Zhang X, Osterman A, et al. Constraint-based model of Shewanella oneidensis MR-1 metabolism: A tool for data analysis and hypothesis generation. PLoS Computational Biology. 2010;6(6):1–8. [DOI] [PMC free article] [PubMed] [Google Scholar]
- 62.Oftadeh O, Salvy P, Masid M, Curvat M, Miskovic L, Hatzimanikatis V. A genome-scale metabolic model of Saccharomyces cerevisiae that integrates expression constraints and reaction thermodynamics. Nature Communications. 2021;12(1):4790. [DOI] [PMC free article] [PubMed] [Google Scholar]
- 63.Burgard AP, Pharkya P, Maranas CD. OptKnock: A Bilevel Programming Framework for Identifying Gene Knockout Strategies for Microbial Strain Optimization. Biotechnology and Bioengineering. 2003;84(6):647–57. [DOI] [PubMed] [Google Scholar]
- 64.Tepper N, Shlomi T. Predicting metabolic engineering knockout strategies for chemical production: Accounting for competing pathways. Bioinformatics. 2009;26(4):536–43. [DOI] [PubMed] [Google Scholar]
- 65.Stanford NJ, Millard P, Swainston N. RobOKoD: Microbial strain design for (over)production of target compounds. Frontiers in Cell and Developmental Biology. 2015;3:1–12. [DOI] [PMC free article] [PubMed] [Google Scholar]
- 66.Alzoubi D, Desouki AA, Lercher MJ. Flux balance analysis with or without molecular crowding fails to predict two thirds of experimentally observed epistasis in yeast. Scientific Reports. 2019;9(1):1–9. [DOI] [PMC free article] [PubMed] [Google Scholar]
- 67.Gatto F, Miess H, Schulze A, Nielsen J. Flux balance analysis predicts essential genes in clear cell renal cell carcinoma metabolism. Scientific Reports. 2015;5(1):10738. [DOI] [PMC free article] [PubMed] [Google Scholar]
- 68.Santos-Merino M, Gargantilla-Becerra Á, de la Cruz F, Nogales J. Highlighting the potential of Synechococcus elongatus PCC 7942 as platform to produce α-linolenic acid through an updated genome-scale metabolic modeling. Frontiers in Microbiology [Internet]. 2023;14. Available from: https://www.frontiersin.org/articles/10.3389/fmicb.2023.1126030 [DOI] [PMC free article] [PubMed] [Google Scholar]
- 69.Broddrick JT, Welkie DG, Jallet D, Golden SS, Peers G, Palsson BO. Predicting the metabolic capabilities of Synechococcus elongatus PCC 7942 adapted to different light regimes. Metabolic Engineering. 2019;52:42–56. [DOI] [PMC free article] [PubMed] [Google Scholar]
- 70.Machado D, Herrgård M. Systematic Evaluation of Methods for Integration of Transcriptomic Data into Constraint-Based Models of Metabolism. PLoS Computational Biology. 2014;10(4). [DOI] [PMC free article] [PubMed] [Google Scholar]
- 71.Shinfuku Y, Sorpitiporn N, Sono M, Furusawa C, Hirasawa T, Shimizu H. Development and experimental verification of a genome-scale metabolic model for Corynebacterium glutamicum. Microbial Cell Factories. 2009;8(1):43. [DOI] [PMC free article] [PubMed] [Google Scholar]
- 72.Tepper N, Shlomi T. Predicting metabolic engineering knockout strategies for chemical production: Accounting for competing pathways. Bioinformatics. 2009;26(4):536–43. [DOI] [PubMed] [Google Scholar]
- 73.Duarte NC, Becker SA, Jamshidi N, Thiele I, Mo ML, Vo TD, et al. Global reconstruction of the human metabolic network based on genomic and bibliomic data. Proceedings of the National Academy of Sciences of the United States of America. 2007. Feb;104(6):1777–82. [DOI] [PMC free article] [PubMed] [Google Scholar]
- 74.Sigurdsson MI, Jamshidi N, Steingrimsson E, Thiele I, Palsson BØ. A detailed genome-wide reconstruction of mouse metabolism based on human Recon 1. BMC systems biology. 2010. Oct;4:140. [DOI] [PMC free article] [PubMed] [Google Scholar]
- 75.Kaste JAM, Shachar-Hill Y. Accurate flux predictions using tissue-specific gene expression in plant metabolic modeling. Bioinformatics. 2023. Apr 11;btad186. [DOI] [PMC free article] [PubMed] [Google Scholar]
- 76.Lee JM, Gianchandani EP, Papin JA. Flux balance analysis in the era of metabolomics. Briefings in Bioinformatics. 2006. Apr;7(2):140–50. [DOI] [PubMed] [Google Scholar]
- 77.Lewis NE, Hixson KK, Conrad TM, Lerman JA, Charusanti P, Polpitiya AD, et al. Omic data from evolved E. coli are consistent with computed optimal growth from genome-scale models. Molecular Systems Biology. 2010;6(390). [DOI] [PMC free article] [PubMed] [Google Scholar]
- 78.Gianchandani EP, Oberhardt MA, Burgard AP, Maranas CD, Papin JA. Predicting biological system objectives de novo from internal state measurements. BMC Bioinformatics. 2008. Jan 24;9:43. [DOI] [PMC free article] [PubMed] [Google Scholar]
- 79.Yuan H, Cheung CYM, Hilbers PAJ, van Riel NAW. Flux Balance Analysis of Plant Metabolism: The Effect of Biomass Composition and Model Structure on Model Predictions. Frontiers in Plant Science [Internet]. 2016;7. Available from: https://www.frontiersin.org/articles/10.3389/fpls.2016.00537 [DOI] [PMC free article] [PubMed] [Google Scholar]
- 80.Chen X, Alonso AP, Allen DK, Reed JL, Shachar-Hill Y. Synergy between 13C-metabolic flux analysis and flux balance analysis for understanding metabolic adaption to anaerobiosis in E. coli. Metabolic Engineering. 2011;13(1):38–48. [DOI] [PubMed] [Google Scholar]
- 81.Long CP, Antoniewicz MR. Metabolic flux responses to deletion of 20 core enzymes reveal flexibility and limits of E. coli metabolism. Metabolic engineering. 2019. Sep;55:249–57. [DOI] [PubMed] [Google Scholar]
- 82.Schuetz R, Kuepfer L, Sauer U. Systematic evaluation of objective functions for predicting intracellular fluxes in Escherichia coli. 2007;(119). [DOI] [PMC free article] [PubMed] [Google Scholar]
- 83.Roell GW, Schenk C, Anthony WE, Carr RR, Ponukumati A, Kim J, et al. A High-Quality Genome-Scale Model for Rhodococcus opacus Metabolism. ACS Synth Biol. 2023. Jun 16;12(6):1632–44. [DOI] [PMC free article] [PubMed] [Google Scholar]
- 84.Young JD. INCA: A computational platform for isotopically non-stationary metabolic flux analysis. Bioinformatics. 2014;30(9):1333–5. [DOI] [PMC free article] [PubMed] [Google Scholar]
- 85.Weitzel M, Nöh K, Dalman T, Niedenführ S, Stute B, Wiechert W. 13CFLUX2 - High-performance software suite for 13C-metabolic flux analysis. Bioinformatics. 2013;29(1):143–5. [DOI] [PMC free article] [PubMed] [Google Scholar]
- 86.Shupletsov MS, Golubeva LI, Rubina SS, Podvyaznikov DA, Iwatani S, Mashko SV. OpenFLUX2: 13C-MFA modeling software package adjusted for the comprehensive analysis of single and parallel labeling experiments. Microbial Cell Factories. 2014;13(1):1–25. [DOI] [PMC free article] [PubMed] [Google Scholar]
- 87.Au J, Choi J, Jones SW, Venkataramanan KP, Antoniewicz MR. Parallel labeling experiments validate Clostridium acetobutylicum metabolic network model for (13)C metabolic flux analysis. Metabolic engineering. 2014. Nov;26:23–33. [DOI] [PubMed] [Google Scholar]
- 88.Cordova LT, Antoniewicz MR. (13)C metabolic flux analysis of the extremely thermophilic, fast growing, xylose-utilizing Geobacillus strain LC300. Metabolic engineering. 2016. Jan;33:148–57. [DOI] [PubMed] [Google Scholar]
- 89.Cordova LT, Cipolla RM, Swarup A, Long CP, Antoniewicz MR. (13)C metabolic flux analysis of three divergent extremely thermophilic bacteria: Geobacillus sp. LC300, Thermus thermophilus HB8, and Rhodothermus marinus DSM 4252. Metabolic engineering. 2017. Nov;44:182–90. [DOI] [PMC free article] [PubMed] [Google Scholar]
- 90.Dahle ML, Papoutsakis ET, Antoniewicz MR. 13C-metabolic flux analysis of Clostridium ljungdahlii illuminates its core metabolism under mixotrophic culture conditions. Metabolic Engineering. 2022;72:161–70. [DOI] [PubMed] [Google Scholar]
- 91.Mitosch K, Beyß M, Phapale P, Drotleff B, Nöh K, Alexandrov T, et al. A pathogen-specific isotope tracing approach reveals metabolic activities and fluxes of intracellular Salmonella. PLOS Biology. 2023. Aug 18;21(8):e3002198. [DOI] [PMC free article] [PubMed] [Google Scholar]
- 92.Imada T, Yamamoto C, Toyoshima M, Toya Y, Shimizu H. Effect of light fluctuations on photosynthesis and metabolic flux in Synechocystis sp. PCC 6803. Biotechnology Progress. 2023. May 1;39(3):e3326. [DOI] [PubMed] [Google Scholar]
- 93.Yu King Hing N, Aryal UK, Morgan JA. Probing Light-Dependent Regulation of the Calvin Cycle Using a Multi-Omics Approach. Frontiers in Plant Science [Internet]. 2021;12. Available from: https://www.frontiersin.org/articles/10.3389/fpls.2021.733122 [DOI] [PMC free article] [PubMed] [Google Scholar]
- 94.Sundqvist N, Grankvist N, Watrous J, Mohit J, Nilsson R, Cedersund G. Validation-based model selection for 13C metabolic flux analysis with uncertain measurement errors. PLOS Computational Biology. 2022;18(4):e1009999. [DOI] [PMC free article] [PubMed] [Google Scholar]
- 95.Xu Y, Wieloch T, Kaste JAM, Shachar-Hill Y, Sharkey TD. Reimport of carbon from cytosolic and vacuolar sugar pools into the Calvin-Benson cycle explains photosynthesis labeling anomalies. Proceedings of the National Academy of Sciences. 2022;119(11):e2121531119. [DOI] [PMC free article] [PubMed] [Google Scholar]
- 96.Xu Y, Fu X, Sharkey TD, Shachar-Hill Y, Walker BJ. The metabolic origins of non-photorespiratory CO2 release during photosynthesis: A metabolic flux analysis. Plant Physiology. 2021;186(1):297–314. [DOI] [PMC free article] [PubMed] [Google Scholar]
- 97.Ma F, Jazmin LJ, Young JD, Allen DK. Isotopically nonstationary 13C flux analysis of changes in Arabidopsis thaliana leaf metabolism due to high light acclimation. Proceedings of the National Academy of Sciences of the United States of America. 2014;111(47):16967–72. [DOI] [PMC free article] [PubMed] [Google Scholar]
- 98.Zheng AO, Sher A, Fridman D, Musante CJ, Young JD. Pool size measurements improve precision of flux estimates but increase sensitivity to unmodeled reactions outside the core network in isotopically nonstationary metabolic flux analysis (INST-MFA). Biotechnology Journal. 2022;17(3):1–17. [DOI] [PubMed] [Google Scholar]
- 99.Krueger S, Giavalisco P, Krall L, Steinhauser MC, Büssis D, Usadel B, et al. A topological map of the compartmentalized Arabidopsis thaliana leaf metabolome. PLoS One. 2011;6(3):e17806. [DOI] [PMC free article] [PubMed] [Google Scholar]
- 100.Gopalakrishnan S, Maranas CD. 13C metabolic flux analysis at a genome-scale. Metabolic Engineering. 2015;32:12–22. [DOI] [PubMed] [Google Scholar]
- 101.Hendry JI, Dinh HV, Foster C, Gopalakrishnan S, Wang L, Maranas CD. Metabolic flux analysis reaching genome wide coverage: lessons learned and future perspectives. Current Opinion in Chemical Engineering. 2020;30:17–25. [Google Scholar]
- 102.Gopalakrishnan S, Pakrasi HB, Maranas CD. Elucidation of photoautotrophic carbon flux topology in Synechocystis PCC 6803 using genome-scale carbon mapping models. Metabolic engineering. 2018. May;47:190–9. [DOI] [PubMed] [Google Scholar]
- 103.Hendry JI, Gopalakrishnan S, Ungerer J, Pakrasi HB, Tang YJ, Maranas CD. Genome-Scale Fluxome of Synechococcus elongatus UTEX 2973 Using Transient 13C-Labeling Data. Plant Physiology. 2019. Feb 1;179(2):761–9. [DOI] [PMC free article] [PubMed] [Google Scholar]
- 104.Draper NR, Smith H. Extra Sums of Squares and Tests for Several Parameters Being Zero. In: Applied Regression Analysis [Internet]. John Wiley & Sons, Ltd; 1998. p. 149–77. Available from: https://onlinelibrary.wiley.com/doi/abs/10.1002/9781118625590.ch6 [Google Scholar]
- 105.Boyle NR, Sengupta N, Morgan JA. Metabolic flux analysis of heterotrophic growth in Chlamydomonas reinhardtii. PLoS ONE. 2017;12(5):1–23. [DOI] [PMC free article] [PubMed] [Google Scholar]
- 106.Akaike H Information Theory and an Extension of the Maximum Likelihood Principle. In: Parzen E, Tanabe K, Kitagawa G, editors. Selected Papers of Hirotugu Akaike [Internet]. New York, NY: Springer New York; 1998. p. 199–213. Available from: 10.1007/978-1-4612-1694-0_15 [DOI] [Google Scholar]
- 107.Schwarz G Estimating the Dimension of a Model. The Annals of Statistics. 1978;6(2):461–4. [Google Scholar]
- 108.Dalman T, Wiechert W, Nöh K. A scientific workflow framework for 13C metabolic flux analysis. Journal of Biotechnology. 2016;232:12–24. [DOI] [PubMed] [Google Scholar]
- 109.Gebreselassie NA, Antoniewicz MR. (13)C-metabolic flux analysis of co-cultures: A novel approach. Metabolic engineering. 2015. Sep;31:132–9. [DOI] [PMC free article] [PubMed] [Google Scholar]
- 110.Wolfsberg E, Long CP, Antoniewicz MR. Metabolism in dense microbial colonies: (13)C metabolic flux analysis of E. coli grown on agar identifies two distinct cell populations with acetate cross-feeding. Metabolic engineering. 2018. Sep;49:242–7. [DOI] [PubMed] [Google Scholar]
- 111.Ahn WS, Crown SB, Antoniewicz MR. Evidence for transketolase-like TKTL1 flux in CHO cells based on parallel labeling experiments and (13)C-metabolic flux analysis. Metabolic engineering. 2016. Sep;37:72–8. [DOI] [PMC free article] [PubMed] [Google Scholar]
- 112.Hastie T, Tibshirani R, Friedman J. Model Assessment and Selection. In: The Elements of Statistical Learning: Data Mining, Inference, and Prediction. 2017. p. 219–60. [Google Scholar]
- 113.Nicolae A, Wahrheit J, Bahnemann J, Zeng AP, Heinzle E. Non-stationary 13C metabolic flux analysis of Chinese hamster ovary cells in batch culture using extracellular labeling highlights metabolic reversibility and compartmentation. BMC Systems Biology. 2014. Apr 28;8(1):50. [DOI] [PMC free article] [PubMed] [Google Scholar]
- 114.Nöh K, Grönke K, Luo B, Takors R, Oldiges M, Wiechert W. Metabolic flux analysis at ultra short time scale: Isotopically non-stationary 13C labeling experiments. Journal of Biotechnology. 2007. Apr 30;129(2):249–67. [DOI] [PubMed] [Google Scholar]
- 115.Smith EN, Ratcliffe RG, Kruger NJ. Isotopically non-stationary metabolic flux analysis of heterotrophic Arabidopsis thaliana cell cultures. Frontiers in plant science. 2022;13:1049559. [DOI] [PMC free article] [PubMed] [Google Scholar]
Associated Data
This section collects any data citations, data availability statements, or supplementary materials included in this article.
Data Availability Statement
No data was generated as part of this study.