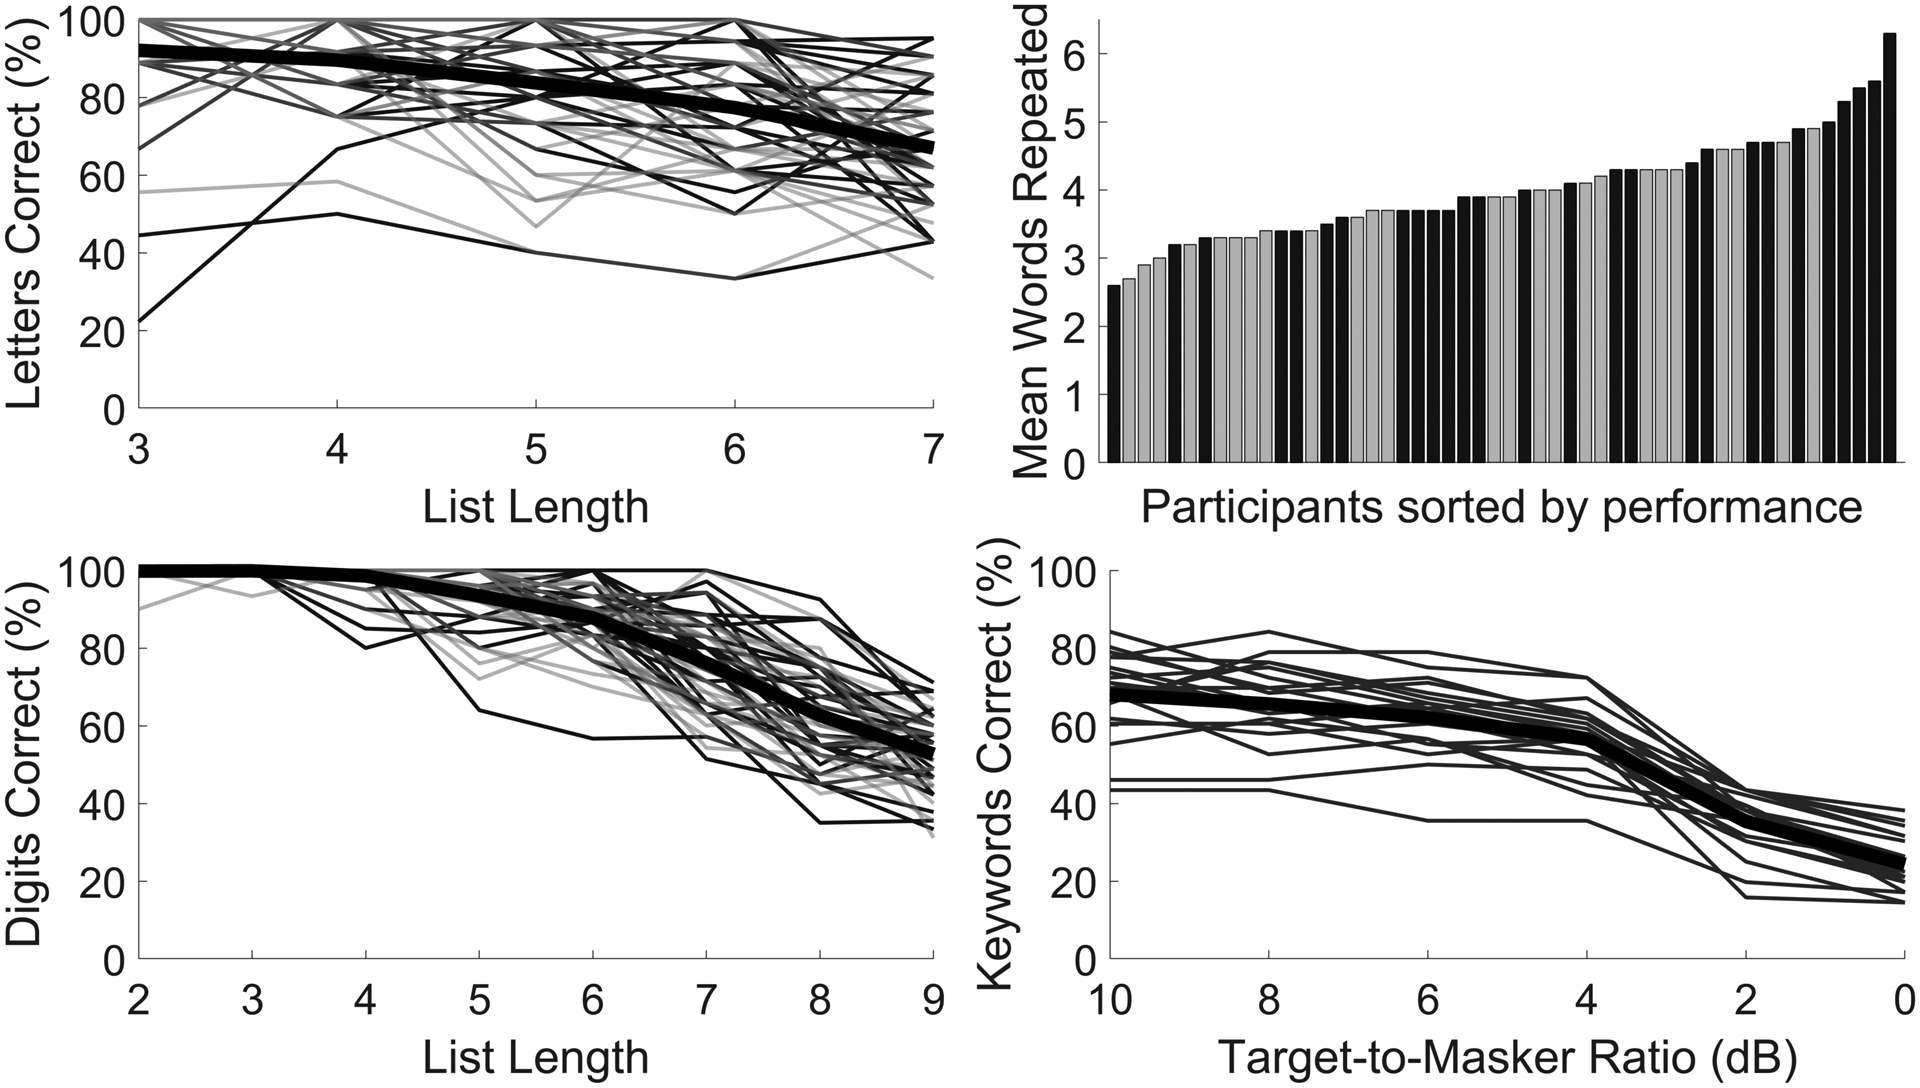
Figure 1.

Performance on working memory and speech tasks. For reading span (top left) and digit span (bottom left), edit distance score as a percentage of maximum possible score is shown as a function of list length. Thin lines show recall accuracy for each participant, and the thick line shows the group average. In-lab participants are depicted with black lines and remote participants are depicted with gray lines. For free recall (top right), the number of items in each list was fixed, so the average number of items recalled across all lists is shown as a bar for each participant. In-lab participants are depicted with black bars and remote participants are depicted with gray bars. For speech recognition (bottom right), keyword recognition accuracy is shown a as a function of target-to-masker ratio. Thin lines show keyword recognition accuracy for each participant, and the thick line shows the group average.
